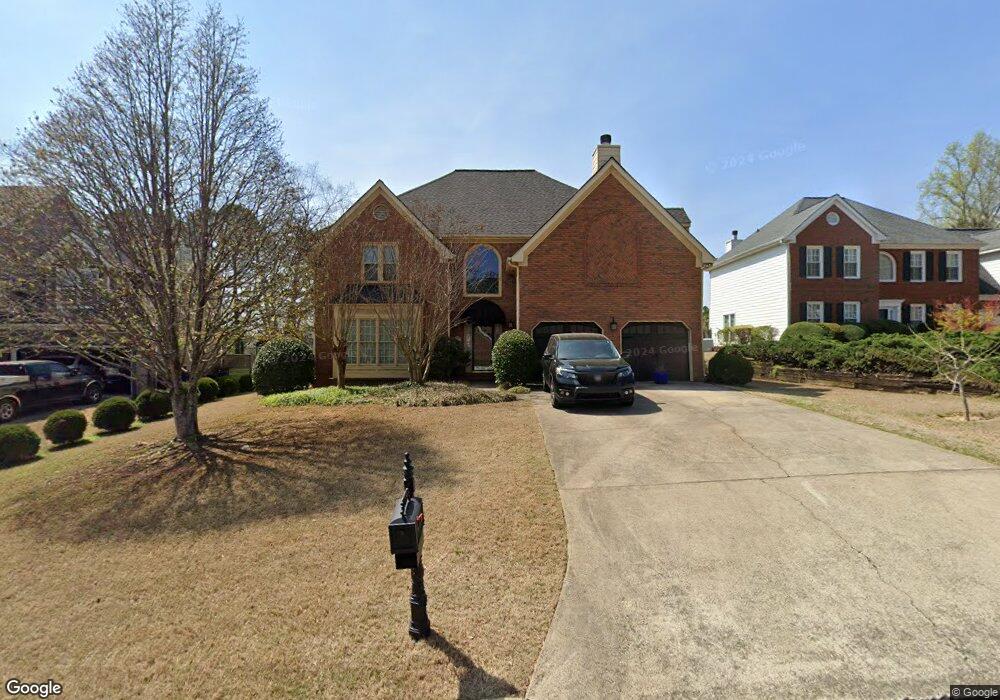
430 N Pine Dr Unit 2 Alpharetta, GA 30022
Estimated Value: $703,541 - $821,000
4
Beds
3
Baths
3,027
Sq Ft
$243/Sq Ft
Est. Value
About This Home
This home is located at 430 N Pine Dr Unit 2, Alpharetta, GA 30022 and is currently estimated at $734,885, approximately $242 per square foot. 430 N Pine Dr Unit 2 is a home located in Fulton County with nearby schools including Ocee Elementary School, Taylor Road Middle School, and Chattahoochee High School.
Ownership History
Date
Name
Owned For
Owner Type
Purchase Details
Closed on
Jul 13, 2020
Sold by
Hoat John R
Bought by
Hoats Elizabeth A
Current Estimated Value
Home Financials for this Owner
Home Financials are based on the most recent Mortgage that was taken out on this home.
Original Mortgage
$200,000
Outstanding Balance
$138,646
Interest Rate
3.2%
Mortgage Type
New Conventional
Estimated Equity
$596,239
Purchase Details
Closed on
Oct 8, 1998
Sold by
Hoats John R
Bought by
Hoats Elizabeth A
Home Financials for this Owner
Home Financials are based on the most recent Mortgage that was taken out on this home.
Original Mortgage
$170,000
Interest Rate
6.76%
Mortgage Type
New Conventional
Purchase Details
Closed on
Oct 2, 1998
Sold by
Nolan Chris P and Nolan Tracy M
Bought by
Hoats John R
Home Financials for this Owner
Home Financials are based on the most recent Mortgage that was taken out on this home.
Original Mortgage
$170,000
Interest Rate
6.76%
Mortgage Type
New Conventional
Create a Home Valuation Report for This Property
The Home Valuation Report is an in-depth analysis detailing your home's value as well as a comparison with similar homes in the area
Home Values in the Area
Average Home Value in this Area
Purchase History
| Date | Buyer | Sale Price | Title Company |
|---|---|---|---|
| Hoats Elizabeth A | -- | -- | |
| Hoats Elizabeth A | -- | -- | |
| Hoats John R | $200,000 | -- |
Source: Public Records
Mortgage History
| Date | Status | Borrower | Loan Amount |
|---|---|---|---|
| Open | Hoats Elizabeth A | $200,000 | |
| Previous Owner | Hoats John R | $170,000 |
Source: Public Records
Tax History Compared to Growth
Tax History
| Year | Tax Paid | Tax Assessment Tax Assessment Total Assessment is a certain percentage of the fair market value that is determined by local assessors to be the total taxable value of land and additions on the property. | Land | Improvement |
|---|---|---|---|---|
| 2025 | $687 | $278,440 | $50,400 | $228,040 |
| 2023 | $687 | $251,840 | $39,600 | $212,240 |
| 2022 | $3,713 | $184,080 | $31,560 | $152,520 |
| 2021 | $4,111 | $161,800 | $28,280 | $133,520 |
| 2020 | $3,999 | $159,960 | $28,320 | $131,640 |
| 2019 | $463 | $157,120 | $27,800 | $129,320 |
| 2018 | $3,692 | $153,440 | $27,160 | $126,280 |
| 2017 | $3,227 | $123,000 | $25,480 | $97,520 |
| 2016 | $3,210 | $123,000 | $25,480 | $97,520 |
| 2015 | $3,729 | $123,000 | $25,480 | $97,520 |
| 2014 | $2,573 | $96,680 | $17,360 | $79,320 |
Source: Public Records
Map
Nearby Homes
- 105 Kimball Bridge Cove
- 10880 Windham Way
- 345 Kincardine Way Unit IIIA
- 3962 Erin Dr
- 285 Rolling Mist Ct
- 10530 Tuxford Dr
- 465 Kirkstall Trail
- 4465 Hawthorn Cir
- 4462 Hawthorn Cir
- 4475 Hawthorn Cir
- 125 Sandridge Ct
- 710 Country Manor Way
- 10845 Carrissa Trail
- 3965 Brookline Dr
- 610 Varina Way
- 3010 Brooke View Ct Unit 5
- 440 N Pine Dr
- 420 N Pine Dr Unit 2
- N N Pine Dr
- 410 N Pine Dr Unit 27
- 410 N Pine Dr
- 10730 S Kimball Bridge Crossing Unit CRS
- 10720 S Kimball Bridge Crossing
- 450 N Pine Dr Unit 2
- 10710 S Kimball Bridge Crossing Unit CRS
- 10740 S Kimball Bridge Crossing
- 435 N Pine Dr Unit 2
- 445 N Pine Dr Unit 2
- 425 N Pine Dr
- 10750 S Kimball Bridge Crossing Unit 2
- 460 N Pine Dr Unit 2
- 10700 S Kimball Bridge Crossing
- 10800 S Kimball Bridge Crossing Unit 28A
- 10800 S Kimball Bridge Crossing
- 465 N Pine Dr
- 10790 S Kimball Bridge Crossing Unit CRS