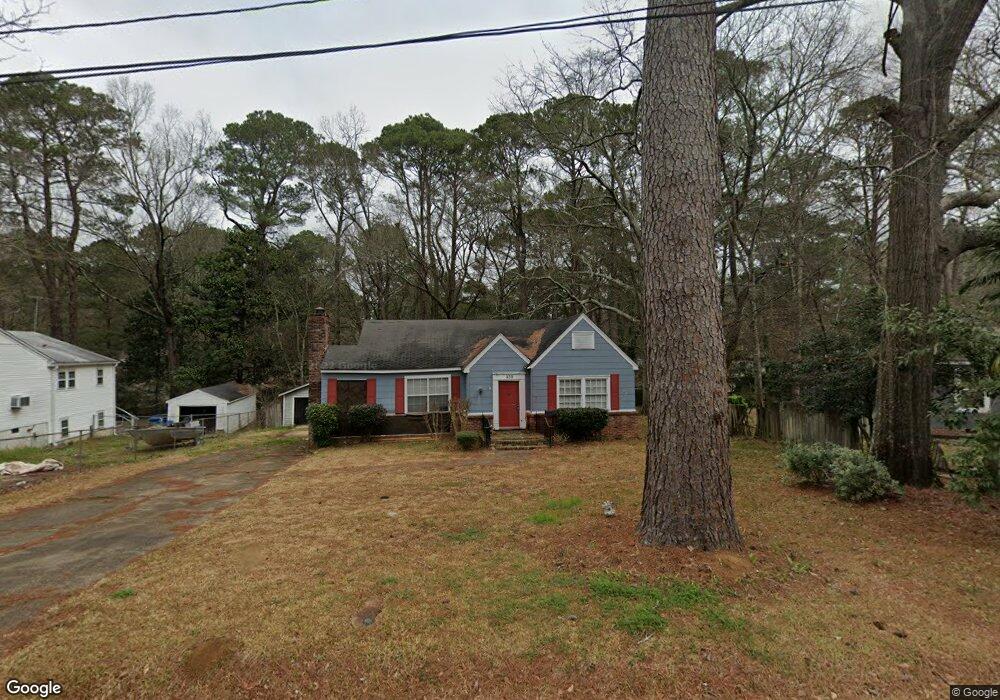
430 Pinecrest Cir Jackson, MS 39204
South Jackson NeighborhoodEstimated Value: $51,000 - $72,000
3
Beds
1
Bath
1,469
Sq Ft
$41/Sq Ft
Est. Value
About This Home
This home is located at 430 Pinecrest Cir, Jackson, MS 39204 and is currently estimated at $60,527, approximately $41 per square foot. 430 Pinecrest Cir is a home located in Hinds County with nearby schools including Peeples Middle School, Jim Hill High School, and Reimagine Prep Middle School.
Ownership History
Date
Name
Owned For
Owner Type
Purchase Details
Closed on
Nov 3, 2020
Sold by
Bob Lucroy Renovations Inc
Bought by
Alta Woods Revival Trust 7
Current Estimated Value
Purchase Details
Closed on
Aug 1, 2017
Sold by
430 Pine Crest Circle Trust
Bought by
Neal Jori
Home Financials for this Owner
Home Financials are based on the most recent Mortgage that was taken out on this home.
Original Mortgage
$18,638
Interest Rate
3.96%
Mortgage Type
New Conventional
Purchase Details
Closed on
Nov 19, 2015
Sold by
Good Neighbor Investments Llc
Bought by
Blackstone Holdings Llc and 430 Pine Crest Circle Trust
Purchase Details
Closed on
Oct 1, 2015
Sold by
Good Neighbor Investments Llc
Bought by
430 Pine Crest Circle Trust and Blackstone Holdings Llc
Purchase Details
Closed on
Aug 5, 2013
Sold by
Healy Floyd
Bought by
Good Neighbor Investments Llc
Create a Home Valuation Report for This Property
The Home Valuation Report is an in-depth analysis detailing your home's value as well as a comparison with similar homes in the area
Home Values in the Area
Average Home Value in this Area
Purchase History
| Date | Buyer | Sale Price | Title Company |
|---|---|---|---|
| Alta Woods Revival Trust 7 | -- | None Available | |
| Neal Jori | -- | None Available | |
| Blackstone Holdings Llc | -- | None Available | |
| 430 Pine Crest Circle Trust | -- | None Available | |
| Good Neighbor Investments Llc | $16,281 | -- |
Source: Public Records
Mortgage History
| Date | Status | Borrower | Loan Amount |
|---|---|---|---|
| Previous Owner | Neal Jori | $18,638 | |
| Previous Owner | Neal Jori | $6,119 |
Source: Public Records
Tax History
| Year | Tax Paid | Tax Assessment Tax Assessment Total Assessment is a certain percentage of the fair market value that is determined by local assessors to be the total taxable value of land and additions on the property. | Land | Improvement |
|---|---|---|---|---|
| 2025 | $1,275 | $6,732 | $1,800 | $4,932 |
| 2024 | $1,275 | $6,596 | $1,800 | $4,796 |
| 2023 | $1,275 | $6,596 | $1,800 | $4,796 |
| 2022 | $1,269 | $6,596 | $1,800 | $4,796 |
| 2021 | $1,269 | $6,596 | $1,800 | $4,796 |
| 2020 | $1,253 | $6,552 | $1,800 | $4,752 |
| 2019 | $1,255 | $6,552 | $1,800 | $4,752 |
| 2018 | $1,241 | $6,552 | $1,800 | $4,752 |
| 2017 | $1,209 | $6,552 | $1,800 | $4,752 |
| 2016 | $1,209 | $6,552 | $1,800 | $4,752 |
| 2015 | $1,203 | $6,722 | $1,800 | $4,922 |
| 2014 | $1,202 | $6,722 | $1,800 | $4,922 |
Source: Public Records
Map
Nearby Homes
- 308 Alta Woods Blvd
- 359 Cummins St
- 423 Cummins St
- 1924 Willow Way
- 2112 Paden St
- 264 Shady Cir
- 2001 Paden St
- 233 Colonial Dr
- 2123 Belvedere Dr
- 1939 Belvedere Dr
- 1922 Shamrock Dr
- 2416 Paden St
- 2647 Glenn St
- 2438 Paden St
- 1867 Shamrock Dr
- 2451 Coronet Place
- 1861 Shamrock Dr
- 2712 Hillside Dr
- 1840 Willaneel Dr
- 837 Combs St
- 112 Pinecrest Cir
- 116 Pinecrest Cir
- 501 Merigold Dr
- 110 Pinecrest Cir
- 507 Merigold Dr
- 449 Merigold Dr
- 513 Merigold Dr
- 420 Pinecrest Cir
- 111 Pinecrest Cir
- 441 Merigold Dr
- 108 Pinecrest Cir
- 511 Pinecrest Cir
- 115 Pinecrest Cir
- 519 Merigold Dr
- 435 Merigold Dr
- 525 Merigold Dr
- 104 Pinecrest Cir
- 122 Pinecrest Cir
- 531 Merigold Dr
- 425 Merigold Dr
Your Personal Tour Guide
Ask me questions while you tour the home.