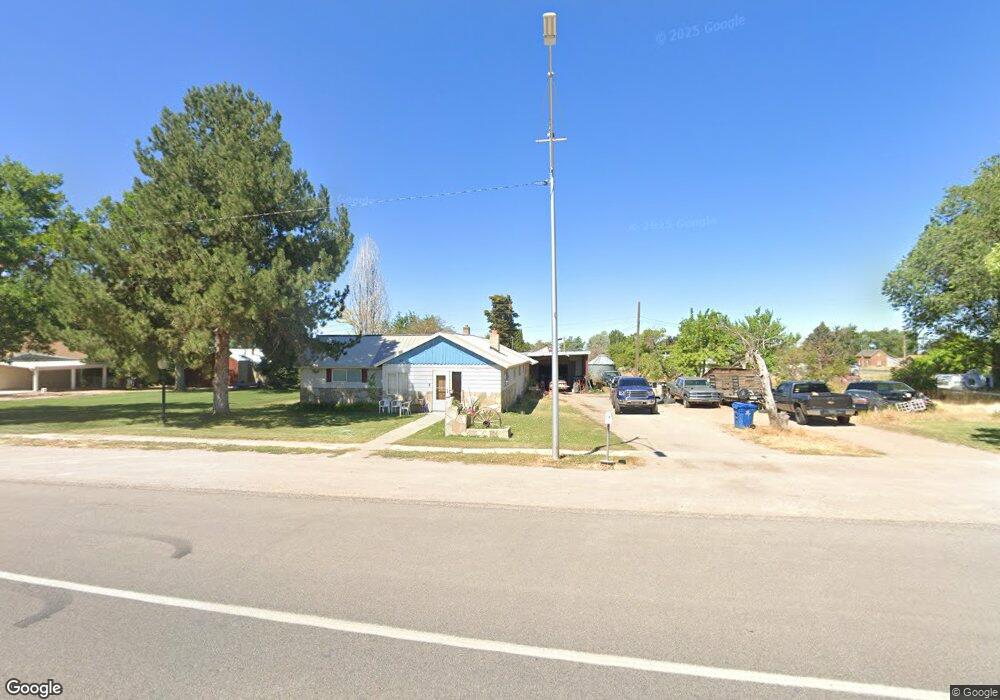
430 S Main St Fillmore, UT 84631
Estimated Value: $285,234 - $313,000
3
Beds
1
Bath
1,497
Sq Ft
$200/Sq Ft
Est. Value
About This Home
This home is located at 430 S Main St, Fillmore, UT 84631 and is currently estimated at $298,809, approximately $199 per square foot. 430 S Main St is a home located in Millard County.
Ownership History
Date
Name
Owned For
Owner Type
Purchase Details
Closed on
May 6, 2021
Sold by
Alison Robison Ancil
Bought by
Ancil Alison Robison Family Trust
Current Estimated Value
Home Financials for this Owner
Home Financials are based on the most recent Mortgage that was taken out on this home.
Original Mortgage
$190,486
Outstanding Balance
$170,662
Interest Rate
2.8%
Mortgage Type
FHA
Estimated Equity
$128,147
Purchase Details
Closed on
Mar 31, 2021
Sold by
Robison Ancil Alison
Bought by
Ancil Alison Robison Family Trust and Wade
Home Financials for this Owner
Home Financials are based on the most recent Mortgage that was taken out on this home.
Original Mortgage
$190,486
Outstanding Balance
$170,662
Interest Rate
2.8%
Mortgage Type
FHA
Estimated Equity
$128,147
Purchase Details
Closed on
Dec 28, 2017
Sold by
Decker Robinson Ancil Alison and Decker Robinson Gladys
Bought by
Robison Ancil Alison and Robison Family Trust
Create a Home Valuation Report for This Property
The Home Valuation Report is an in-depth analysis detailing your home's value as well as a comparison with similar homes in the area
Home Values in the Area
Average Home Value in this Area
Purchase History
| Date | Buyer | Sale Price | Title Company |
|---|---|---|---|
| Ancil Alison Robison Family Trust | -- | -- | |
| Ancil Alison Robison Family Trust | -- | -- | |
| Ancil Alison Robison Family Trust | -- | -- | |
| Guild Mtg Co Llc | $8,115 | First American Title | |
| Garay Isaias | -- | First American Title | |
| Robison Ancil Alison | -- | None Available |
Source: Public Records
Mortgage History
| Date | Status | Borrower | Loan Amount |
|---|---|---|---|
| Open | Garay Isaias | $190,486 |
Source: Public Records
Tax History Compared to Growth
Tax History
| Year | Tax Paid | Tax Assessment Tax Assessment Total Assessment is a certain percentage of the fair market value that is determined by local assessors to be the total taxable value of land and additions on the property. | Land | Improvement |
|---|---|---|---|---|
| 2025 | $1,616 | $202,948 | $33,086 | $169,862 |
| 2024 | $1,616 | $153,196 | $25,596 | $127,600 |
| 2023 | $1,637 | $153,196 | $25,596 | $127,600 |
| 2022 | $1,362 | $122,338 | $23,269 | $99,069 |
| 2021 | $1,188 | $102,386 | $15,110 | $87,276 |
| 2020 | $1,100 | $95,351 | $13,736 | $81,615 |
| 2019 | $939 | $81,699 | $13,736 | $67,963 |
| 2018 | $896 | $79,782 | $13,736 | $66,046 |
| 2017 | $586 | $49,579 | $13,736 | $35,843 |
| 2016 | $560 | $49,579 | $13,736 | $35,843 |
| 2015 | $560 | $49,579 | $13,736 | $35,843 |
| 2014 | -- | $49,579 | $13,736 | $35,843 |
| 2013 | -- | $49,579 | $13,736 | $35,843 |
Source: Public Records
Map
Nearby Homes
- 155 E 500 St S
- 157 E 500 South St
- 190 W 400 St S
- 220 S 200 E
- 405 E 500 St S
- 40 S 100 Rd E
- 430 E Canyon Rd
- 760 E 700 St S
- 310 S 500 West Rd
- 75 N 100 West St
- 310 S 600 E
- 690 E 500 S
- 165 N 100 W
- 225 W 200 St N
- 295 N 100 West St
- 750 800 South Fillmore
- 825 800 South Fillmore
- 800 800 South Fillmore
- 390 N 100 W
- 1100 S 725 Rd W