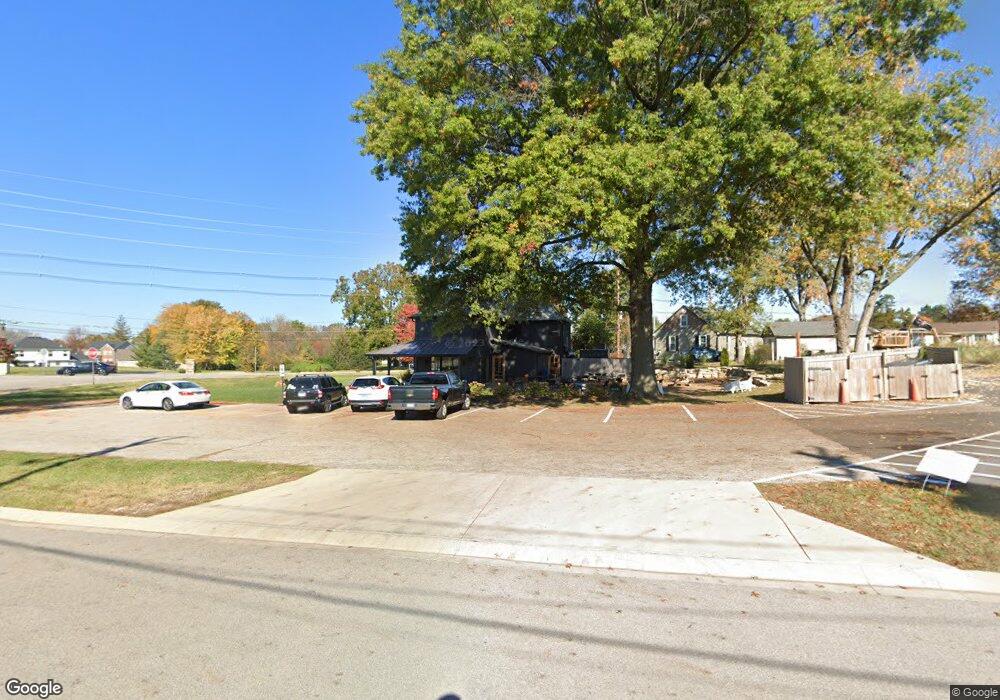
430 S Main St O Fallon, IL 62269
Estimated Value: $199,000 - $308,802
--
Bed
--
Bath
1,020
Sq Ft
$264/Sq Ft
Est. Value
About This Home
This home is located at 430 S Main St, O Fallon, IL 62269 and is currently estimated at $269,451, approximately $264 per square foot. 430 S Main St is a home located in St. Clair County with nearby schools including Shiloh Elementary School, Shiloh Middle School, and O'Fallon Township High School.
Ownership History
Date
Name
Owned For
Owner Type
Purchase Details
Closed on
Jun 11, 2020
Sold by
Banks Fcb
Bought by
Golden Hour Real Estate Llc
Current Estimated Value
Home Financials for this Owner
Home Financials are based on the most recent Mortgage that was taken out on this home.
Original Mortgage
$48,000
Interest Rate
3.2%
Mortgage Type
Future Advance Clause Open End Mortgage
Purchase Details
Closed on
Oct 12, 2018
Sold by
Couch William A and Couch Madeline C
Bought by
Banks Fcb
Purchase Details
Closed on
Nov 4, 2005
Sold by
Schad John P and Jean Schad M
Bought by
Couch William A and Couch Madeline C
Home Financials for this Owner
Home Financials are based on the most recent Mortgage that was taken out on this home.
Original Mortgage
$145,000
Interest Rate
6.95%
Mortgage Type
Purchase Money Mortgage
Create a Home Valuation Report for This Property
The Home Valuation Report is an in-depth analysis detailing your home's value as well as a comparison with similar homes in the area
Home Values in the Area
Average Home Value in this Area
Purchase History
| Date | Buyer | Sale Price | Title Company |
|---|---|---|---|
| Golden Hour Real Estate Llc | $60,000 | Illinois Title & Escrow | |
| Banks Fcb | -- | First American Title | |
| Couch William A | $145,000 | Fatic |
Source: Public Records
Mortgage History
| Date | Status | Borrower | Loan Amount |
|---|---|---|---|
| Closed | Golden Hour Real Estate Llc | $48,000 | |
| Previous Owner | Couch William A | $145,000 |
Source: Public Records
Tax History Compared to Growth
Tax History
| Year | Tax Paid | Tax Assessment Tax Assessment Total Assessment is a certain percentage of the fair market value that is determined by local assessors to be the total taxable value of land and additions on the property. | Land | Improvement |
|---|---|---|---|---|
| 2024 | $7,730 | $104,271 | $8,360 | $95,911 |
| 2023 | $7,676 | $101,204 | $8,114 | $93,090 |
| 2022 | $7,371 | $94,267 | $7,558 | $86,709 |
| 2021 | $2,098 | $26,999 | $7,782 | $19,217 |
| 2020 | $2,095 | $46,576 | $7,110 | $39,466 |
| 2019 | $3,329 | $39,887 | $7,386 | $32,501 |
| 2018 | $3,271 | $38,748 | $7,175 | $31,573 |
| 2017 | $2,238 | $36,928 | $6,838 | $30,090 |
| 2016 | $2,213 | $36,225 | $6,708 | $29,517 |
| 2014 | $2,866 | $35,718 | $7,947 | $27,771 |
| 2013 | $2,788 | $36,199 | $8,054 | $28,145 |
Source: Public Records
Map
Nearby Homes
- 3745 Thicket Dr
- 3772 Osprey Ct
- 417 Shiloh Station Rd
- 409 Sage Dr
- 505 Master Ct
- 414 Shiloh Station Rd
- 3740 Golfview Cir
- 3714 Thicket Dr
- 417 Briarberry Dr
- 433 Briarberry Dr
- 3716 Osprey Ct
- 414 Grand Reserve
- 3700 Osprey Ct
- 3533 Capri Ln
- 101 Montrose Ct
- 120 Cindy Ln Unit 102-120
- 3567 Sky Hawk Dr
- 3536 Harbor Way
- 3531 Chippewa Dr
- 3463 Dakota Dr