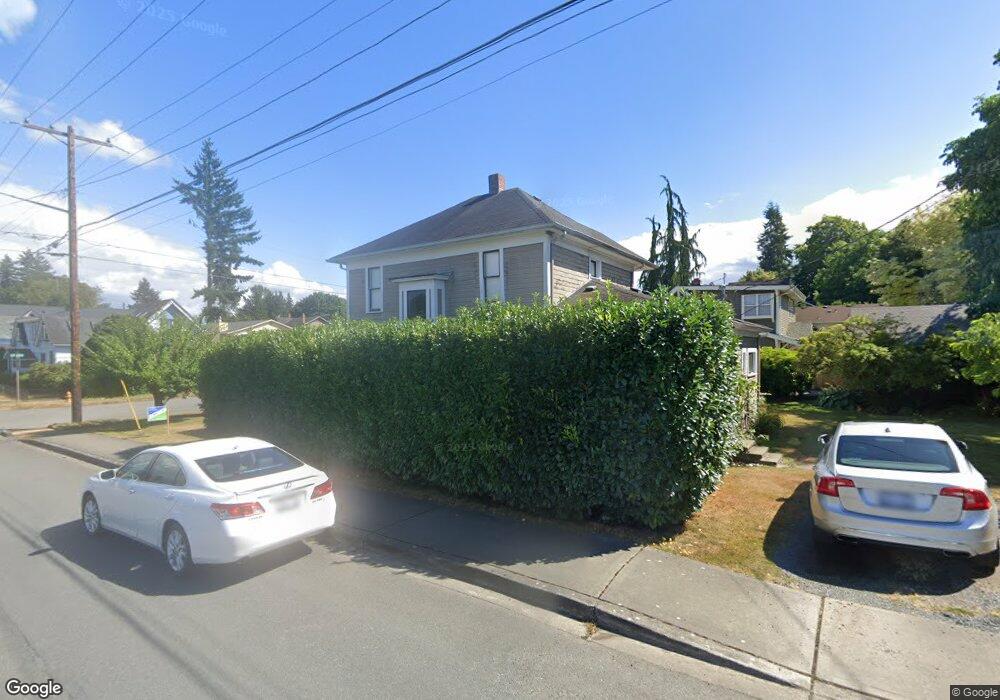
430 Union Ave Snohomish, WA 98290
Estimated Value: $652,106 - $752,000
4
Beds
2
Baths
1,566
Sq Ft
$447/Sq Ft
Est. Value
About This Home
This home is located at 430 Union Ave, Snohomish, WA 98290 and is currently estimated at $700,527, approximately $447 per square foot. 430 Union Ave is a home located in Snohomish County with nearby schools including Central Emerson Elementary School, Centennial Middle School, and Snohomish High School.
Ownership History
Date
Name
Owned For
Owner Type
Purchase Details
Closed on
Nov 17, 1999
Sold by
Jones Tracey K
Bought by
Knafla Troy L and Knafla Sandra L
Current Estimated Value
Home Financials for this Owner
Home Financials are based on the most recent Mortgage that was taken out on this home.
Original Mortgage
$213,498
Outstanding Balance
$66,176
Interest Rate
7.95%
Mortgage Type
FHA
Estimated Equity
$634,351
Purchase Details
Closed on
Sep 19, 1997
Sold by
Radford Ronald V and Radford Kathy K
Bought by
Jones Tracey K
Home Financials for this Owner
Home Financials are based on the most recent Mortgage that was taken out on this home.
Original Mortgage
$75,000
Interest Rate
9.25%
Create a Home Valuation Report for This Property
The Home Valuation Report is an in-depth analysis detailing your home's value as well as a comparison with similar homes in the area
Home Values in the Area
Average Home Value in this Area
Purchase History
| Date | Buyer | Sale Price | Title Company |
|---|---|---|---|
| Knafla Troy L | $215,000 | Evergreen Title Company Inc | |
| Jones Tracey K | $154,950 | -- |
Source: Public Records
Mortgage History
| Date | Status | Borrower | Loan Amount |
|---|---|---|---|
| Open | Knafla Troy L | $213,498 | |
| Previous Owner | Jones Tracey K | $75,000 |
Source: Public Records
Tax History Compared to Growth
Tax History
| Year | Tax Paid | Tax Assessment Tax Assessment Total Assessment is a certain percentage of the fair market value that is determined by local assessors to be the total taxable value of land and additions on the property. | Land | Improvement |
|---|---|---|---|---|
| 2025 | $4,842 | $540,700 | $380,200 | $160,500 |
| 2024 | $4,842 | $497,500 | $342,200 | $155,300 |
| 2023 | $4,761 | $542,400 | $370,700 | $171,700 |
| 2022 | $4,876 | $451,500 | $257,600 | $193,900 |
| 2020 | $4,336 | $373,200 | $203,200 | $170,000 |
| 2019 | $4,057 | $356,400 | $188,200 | $168,200 |
| 2018 | $4,356 | $320,400 | $169,400 | $151,000 |
| 2017 | $3,810 | $285,600 | $145,800 | $139,800 |
| 2016 | $2,997 | $217,700 | $120,400 | $97,300 |
| 2015 | $2,733 | $190,100 | $99,300 | $90,800 |
| 2013 | $2,355 | $159,000 | $63,200 | $95,800 |
Source: Public Records
Map
Nearby Homes