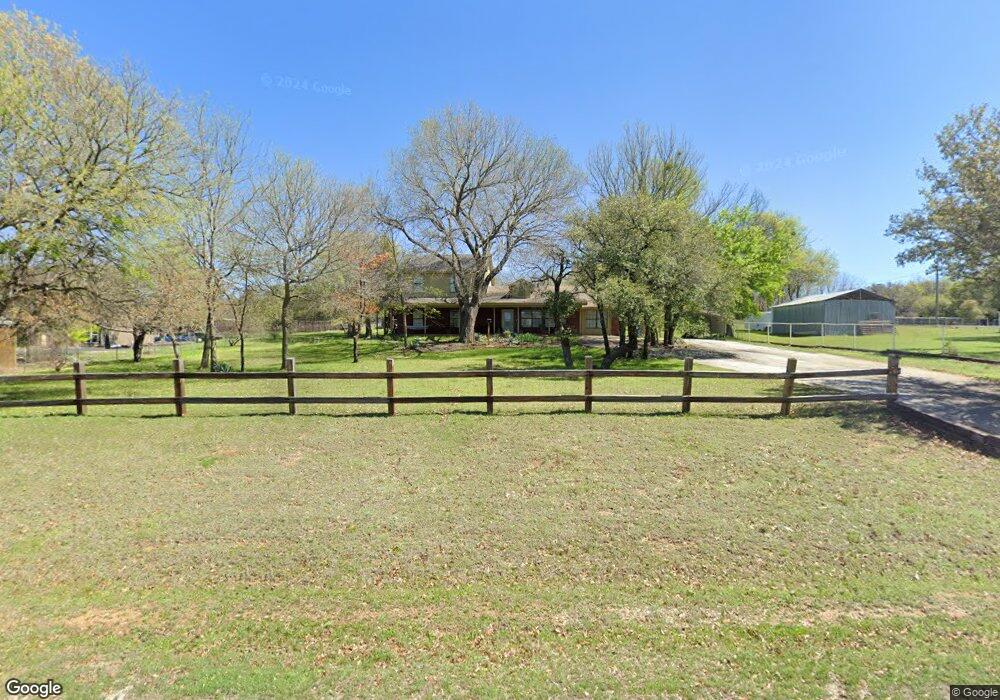
430 Valley Rd Weatherford, TX 76087
Estimated Value: $444,000 - $494,000
3
Beds
3
Baths
2,387
Sq Ft
$193/Sq Ft
Est. Value
About This Home
This home is located at 430 Valley Rd, Weatherford, TX 76087 and is currently estimated at $460,125, approximately $192 per square foot. 430 Valley Rd is a home located in Parker County with nearby schools including Martin Elementary School, Tison Middle School, and Weatherford High School.
Ownership History
Date
Name
Owned For
Owner Type
Purchase Details
Closed on
Apr 22, 2020
Sold by
Pm Oliver Homes Llc
Bought by
Fox Julie Leanne and Fowler Ryan
Current Estimated Value
Home Financials for this Owner
Home Financials are based on the most recent Mortgage that was taken out on this home.
Original Mortgage
$311,912
Outstanding Balance
$275,791
Interest Rate
3.3%
Mortgage Type
VA
Estimated Equity
$184,334
Purchase Details
Closed on
Feb 19, 2020
Sold by
Gonzales Priscilla and Gonzales Priscilla Lea
Bought by
Pm Oliver Homes Llc
Purchase Details
Closed on
Oct 24, 2019
Sold by
Gonzales David
Bought by
Gonzales Priscilla
Purchase Details
Closed on
Aug 21, 2015
Sold by
Cowles James and Cowles Vicki J
Bought by
Gonzales David and Gonzales Priscilla Lea
Home Financials for this Owner
Home Financials are based on the most recent Mortgage that was taken out on this home.
Original Mortgage
$233,700
Interest Rate
4.08%
Mortgage Type
New Conventional
Create a Home Valuation Report for This Property
The Home Valuation Report is an in-depth analysis detailing your home's value as well as a comparison with similar homes in the area
Home Values in the Area
Average Home Value in this Area
Purchase History
| Date | Buyer | Sale Price | Title Company |
|---|---|---|---|
| Fox Julie Leanne | -- | None Available | |
| Pm Oliver Homes Llc | -- | None Available | |
| Gonzales Priscilla | -- | None Available | |
| Gonzales David | -- | Rtt |
Source: Public Records
Mortgage History
| Date | Status | Borrower | Loan Amount |
|---|---|---|---|
| Open | Fox Julie Leanne | $311,912 | |
| Previous Owner | Gonzales David | $233,700 |
Source: Public Records
Tax History Compared to Growth
Tax History
| Year | Tax Paid | Tax Assessment Tax Assessment Total Assessment is a certain percentage of the fair market value that is determined by local assessors to be the total taxable value of land and additions on the property. | Land | Improvement |
|---|---|---|---|---|
| 2025 | $5,053 | $411,170 | -- | -- |
| 2024 | $5,053 | $373,791 | -- | -- |
| 2023 | $5,053 | $339,810 | $0 | $0 |
| 2022 | $5,751 | $308,920 | $50,000 | $258,920 |
| 2021 | $6,236 | $308,920 | $50,000 | $258,920 |
| 2020 | $5,607 | $276,460 | $35,000 | $241,460 |
| 2019 | $5,658 | $276,460 | $35,000 | $241,460 |
| 2018 | $5,171 | $246,000 | $35,000 | $211,000 |
| 2017 | $4,764 | $246,000 | $35,000 | $211,000 |
| 2016 | $4,361 | $196,460 | $20,000 | $176,460 |
| 2015 | $3,496 | $159,640 | $20,000 | $139,640 |
| 2014 | -- | $152,440 | $35,000 | $117,440 |
Source: Public Records
Map
Nearby Homes
- Lot 1M Crest
- 1231 E Lake Dr
- 1733 E Lake Dr
- 1016 Emery Ct
- Chapman Plan at Parker Ridge
- Tucker Plan at Parker Ridge
- 1001 Emery Ct
- 318 W Lake Dr
- 117 Post Oak Ct
- 3616 Overlook Manor
- 808 W Lake Dr
- 1025 Gannon Valley Trail
- 1305 Thistle Hill Trail
- 914 W Lake Dr
- 1028 Gannon Valley Trail
- 100 Coronado Trail
- 3609 Marina Link
- 4500 White Settlement Rd
- 2421 E Lake Dr
- 2425 E Lake Dr