NOT LISTED FOR SALE

430 Vermont St Wabash, IN 46992

Estimated Value: $95,019 - $148,000

3 Beds
1 Bath
1,076 Sq Ft
$104/Sq Ft Est. Value

Last Sold October 18, 2013

Last sale price $10,000 $9 Per Sq Ft

Est. 1,018% increase in value since last sale

Current estimated payment $651/month

About This Home

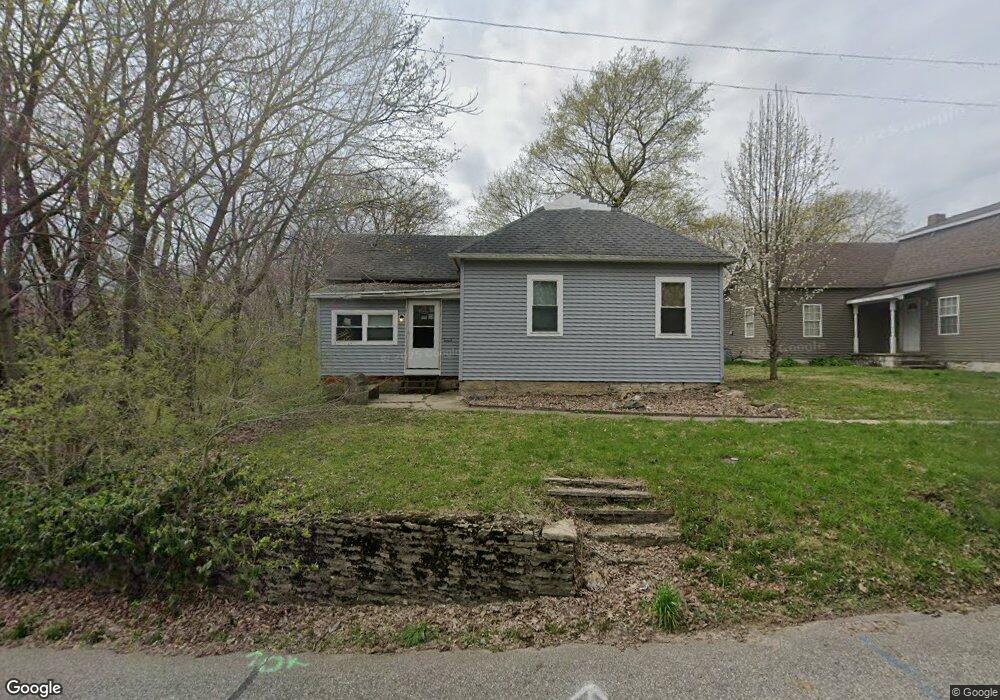
Secluded, woodsy setting--good starter home or investment property--interior has been updated and walls are primed ready for your choice of colors--lots of hardwood throughout--easy access to anyplace in town or U.S.24---Priced at 16,900-

Ownership History

Date Name Owned For Owner Type

Purchase Details

Closed on
Sep 13, 2024
Sold by
P And A Property Management Llc
Bought by
Mes Holdings Llc
Current Estimated Value
$111,755

Purchase Details

Closed on
Dec 27, 2013
Sold by
Somerlot Philip L
Bought by
P And A Property Management Llc

Purchase Details

Listed on
May 25, 2013
Closed on
Oct 17, 2013
Sold by
Logan Douglas E
Bought by
Somerlot Philip L
Seller's Agent
Jan Bailey
Bailey Realty
List Price
$16,900
Sold Price
$10,000
Premium/Discount to List
-$6,900
-40.83%

Home Financials for this Owner

Home Financials are based on the most recent Mortgage that was taken out on this home.
Avg. Annual Appreciation
21.98%

Purchase Details

Closed on
Feb 25, 2011
Sold by
Houston Donald W and Houston Lisa M
Bought by
Logan Douglas E
Source: Public Records

Range of Values:

--
Value Increase
--
Percent Increase
--
Adjusted for Inflation
Collateral Analytics

Collateral Analytics Collateral Analytics AVMs (Automated Valuation Model) employ a number of statistical approaches combined with neighborhood-specific comparable selection guarantees the most up-to-date and precise valuations.

Not Available

Collateral Analytics does not have data for the current month. Please view the chart for historical values.

ICE

ICE Mortgage Technology ICE Mortgage Technology’s AVM (Automated Valuation Model) is a state-of-the-art online residential property valuation tool that provides a quick and accurate estimate of the value of almost any home in the U.S.

Not Available

ICE Mortgage Technology does not have data for the current month. Please view the chart for historical values.

First American

First American First American Data & Analytics’ next-generation AVM combines unrivaled data assets with a blended ensemble of valuation models to produce highly accurate, reliable valuations you can trust.

Not Available

First American does not have data for the current month. Please view the chart for historical values.

Quantarium

Quantarium Quantarium’s valuation service, repeatedly proven the industry’s most accurate and comprehensive, is supercharged with a self-learning and auto-tuning AI engine that continually becomes smarter and more accurate as it processes daily inputs from the industry’s leading RE data lake.

Not Available

Quantarium does not have data for the current month. Please view the chart for historical values.

Average Value
Not Available
List Price
Sold Price
Create a Home Valuation Report for This Property
The Home Valuation Report is an in-depth analysis detailing your home's value as well as a comparison with similar homes in the area

Home Values in the Area

Source: Public Records

Average Home Value in this Area


Source: Public Records

Purchase History

Date Buyer Sale Price Title Company
Mes Holdings Llc -- None Listed On Document
P And A Property Management Llc -- None Available
Somerlot Philip L -- None Available
Logan Douglas E -- --
Source: Public Records

Property History

Date Event Price List to Sale Price per Sq Ft Prior Sale
10/18/2013 10/18/13 Sold $10,000 -40.8% $9 / Sq Ft View Prior Sale
09/18/2013 09/18/13 Pending -- -- --
05/25/2013 05/25/13 For Sale $16,900 -- $16 / Sq Ft

Tax History Compared to Growth

Source: Public Records

Tax History

Year Tax Paid Tax Assessment Tax Assessment Total Assessment is a certain percentage of the fair market value that is determined by local assessors to be the total taxable value of land and additions on the property. Land Improvement
2024 $756 $37,800 $11,500 $26,300
2023 $751 $36,900 $11,500 $25,400
2022 $641 $31,400 $8,000 $23,400
2021 $578 $28,500 $8,000 $20,500
2020 $570 $28,100 $8,000 $20,100
2019 $560 $27,600 $8,000 $19,600
2018 $544 $26,800 $8,000 $18,800
2017 $568 $26,700 $8,000 $18,700
2016 $570 $26,800 $8,100 $18,700
2014 $524 $27,100 $8,100 $19,000
2013 $550 $27,100 $8,000 $19,100
Source: Public Records

Agents Affiliated with this Home

See All Agents

Map