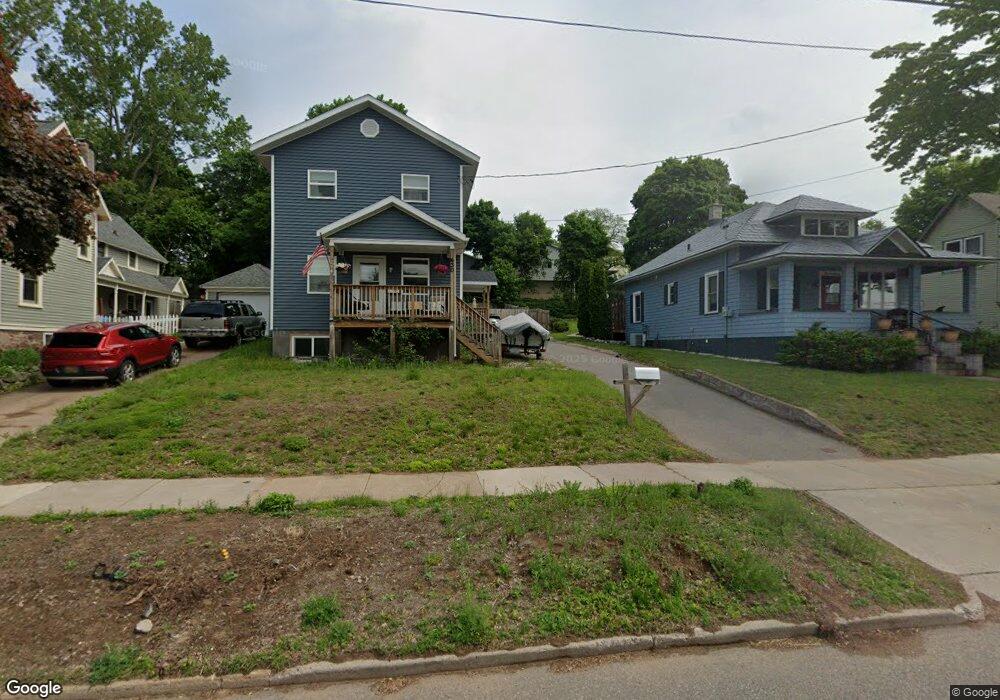
430 W Bluff St Marquette, MI 49855
Estimated Value: $333,000 - $497,000
3
Beds
2
Baths
1,280
Sq Ft
$316/Sq Ft
Est. Value
About This Home
This home is located at 430 W Bluff St, Marquette, MI 49855 and is currently estimated at $403,899, approximately $315 per square foot. 430 W Bluff St is a home located in Marquette County with nearby schools including Sandy Knoll School, Bothwell Middle School, and Marquette Senior High School.
Ownership History
Date
Name
Owned For
Owner Type
Purchase Details
Closed on
Sep 7, 2018
Sold by
Marquette County Habitat For Humanity In
Bought by
Black Lindsay
Current Estimated Value
Home Financials for this Owner
Home Financials are based on the most recent Mortgage that was taken out on this home.
Original Mortgage
$161,400
Outstanding Balance
$143,791
Interest Rate
4.5%
Mortgage Type
New Conventional
Estimated Equity
$260,108
Purchase Details
Closed on
Dec 15, 2017
Sold by
Marquette County Land Bank Authority
Bought by
Marquette County Habitat For H
Home Financials for this Owner
Home Financials are based on the most recent Mortgage that was taken out on this home.
Original Mortgage
$15,000
Interest Rate
3.9%
Mortgage Type
New Conventional
Purchase Details
Closed on
Sep 1, 1987
Bought by
Pringle Rhea R
Create a Home Valuation Report for This Property
The Home Valuation Report is an in-depth analysis detailing your home's value as well as a comparison with similar homes in the area
Home Values in the Area
Average Home Value in this Area
Purchase History
| Date | Buyer | Sale Price | Title Company |
|---|---|---|---|
| Black Lindsay | $10,000 | -- | |
| Marquette County Habitat For H | $15,000 | First American Title Insurance | |
| Pringle Rhea R | $29,900 | -- |
Source: Public Records
Mortgage History
| Date | Status | Borrower | Loan Amount |
|---|---|---|---|
| Open | Black Lindsay | $161,400 | |
| Previous Owner | Marquette County Habitat For H | $15,000 |
Source: Public Records
Tax History Compared to Growth
Tax History
| Year | Tax Paid | Tax Assessment Tax Assessment Total Assessment is a certain percentage of the fair market value that is determined by local assessors to be the total taxable value of land and additions on the property. | Land | Improvement |
|---|---|---|---|---|
| 2025 | $38 | $134,300 | $0 | $0 |
| 2024 | $38 | $114,900 | $0 | $0 |
| 2023 | $3,615 | $100,000 | $0 | $0 |
| 2022 | $3,529 | $92,900 | $0 | $0 |
| 2021 | $2,971 | $94,800 | $0 | $0 |
| 2020 | $2,930 | $92,900 | $0 | $0 |
| 2019 | $3,083 | $88,300 | $0 | $0 |
| 2018 | $1,658 | $0 | $0 | $0 |
| 2017 | $74 | $57,400 | $0 | $0 |
| 2016 | $1,658 | $53,400 | $0 | $0 |
| 2015 | -- | $53,400 | $0 | $0 |
| 2014 | -- | $53,500 | $0 | $0 |
| 2012 | -- | $49,900 | $0 | $0 |
Source: Public Records
Map
Nearby Homes
- 409 Oak St
- 238 W Michigan St
- 615 W Baraga Ave
- 617 W Baraga Ave
- 735 W Ridge St
- 780 S Lakeshore Blvd Unit A/6
- 776 S Lakeshore Blvd
- 744 S Lakeshore Blvd Unit A/15
- 323 N Front St
- 321 N Front St
- 421 N Front St
- 311 S Lakeshore Blvd Unit 3
- 328 W Magnetic St
- 121 Fisher St
- 914 Wilson St
- 450 Mcmillan St
- 322 E Ridge St
- 301 Garfield Ave
- 2001 Wilson St
- 343 E Ridge St