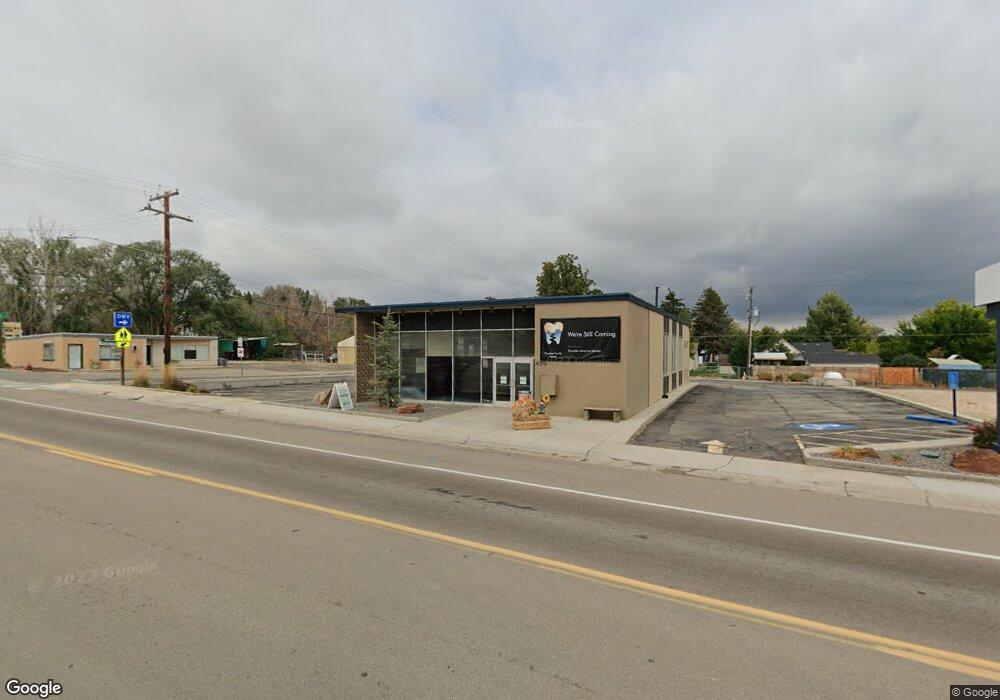
430 W Main St Marsing, ID 83639
Estimated Value: $418,787
--
Bed
--
Bath
3,394
Sq Ft
$123/Sq Ft
Est. Value
About This Home
This home is located at 430 W Main St, Marsing, ID 83639 and is currently estimated at $418,787, approximately $123 per square foot. 430 W Main St is a home located in Owyhee County with nearby schools including Marsing Elementary School, Marsing Middle School, and Marsing High School.
Ownership History
Date
Name
Owned For
Owner Type
Purchase Details
Closed on
Jan 14, 2022
Sold by
Us Bank National Association
Bought by
Martwin Holdings Llc
Current Estimated Value
Home Financials for this Owner
Home Financials are based on the most recent Mortgage that was taken out on this home.
Original Mortgage
$324,000
Outstanding Balance
$297,382
Interest Rate
3.11%
Mortgage Type
New Conventional
Estimated Equity
$121,405
Create a Home Valuation Report for This Property
The Home Valuation Report is an in-depth analysis detailing your home's value as well as a comparison with similar homes in the area
Home Values in the Area
Average Home Value in this Area
Purchase History
| Date | Buyer | Sale Price | Title Company |
|---|---|---|---|
| Martwin Holdings Llc | -- | First American Title |
Source: Public Records
Mortgage History
| Date | Status | Borrower | Loan Amount |
|---|---|---|---|
| Open | Martwin Holdings Llc | $324,000 |
Source: Public Records
Tax History Compared to Growth
Tax History
| Year | Tax Paid | Tax Assessment Tax Assessment Total Assessment is a certain percentage of the fair market value that is determined by local assessors to be the total taxable value of land and additions on the property. | Land | Improvement |
|---|---|---|---|---|
| 2024 | $4,694 | $274,713 | $47,340 | $227,373 |
| 2023 | $2,437 | $206,556 | $47,340 | $159,216 |
| 2022 | $1,918 | $209,136 | $47,340 | $161,796 |
| 2021 | $2,488 | $208,356 | $47,340 | $161,016 |
| 2020 | $2,183 | $165,878 | $47,340 | $118,538 |
| 2019 | $2,541 | $165,878 | $47,340 | $118,538 |
| 2018 | $2,679 | $165,878 | $47,340 | $118,538 |
| 2017 | $2,629 | $165,878 | $47,340 | $118,538 |
| 2016 | $2,490 | $155,467 | $44,973 | $110,494 |
| 2014 | $2,050 | $147,946 | $42,606 | $105,340 |
| 2011 | -- | $126,296 | $26,806 | $99,490 |
Source: Public Records
Map
Nearby Homes
- Poison Creek Rd
- 224 Motzko St
- 405 Live Oak Ave
- TBD Canal St
- 7253 Riverview Dr
- 928 W Main St
- 540 Morning Dove Way
- 311 Riverview Dr
- 309 River View Dr
- 20056 Sunny Slope Rd
- TBD N Bruneau Rd
- 6708 Sunset Ln
- 20477 Lowell Rd
- 13366 Chicken Dinner Rd
- 20264 John Ln
- 18227 Southlake Cir
- 8142 Us Highway 95
- TBD Oak River Ln
- 10430 Randall Ln
- 11326 W Rio Rd
- 7 Reich St
- 420 W Main St
- 5951 Waterview Ln
- 6016 Waterview Ln
- 5958 Waterview Ln
- 4100 Browns Ln
- 5990 Waterview Ln
- 5984 Waterview Ln
- 6022 Waterview Ln
- 5950 Waterview Ln
- 5812 Waterview Ln
- 5914 Waterview Ln
- 5866 Waterview Ln
- 5877 Waterview Ln
- 5893 Waterview Ln
- 5841 Waterview Ln
- 6025 Waterview Ln
- 5987 Waterview Ln
- 5957 Waterview Ln
- 5991 Waterview Ln