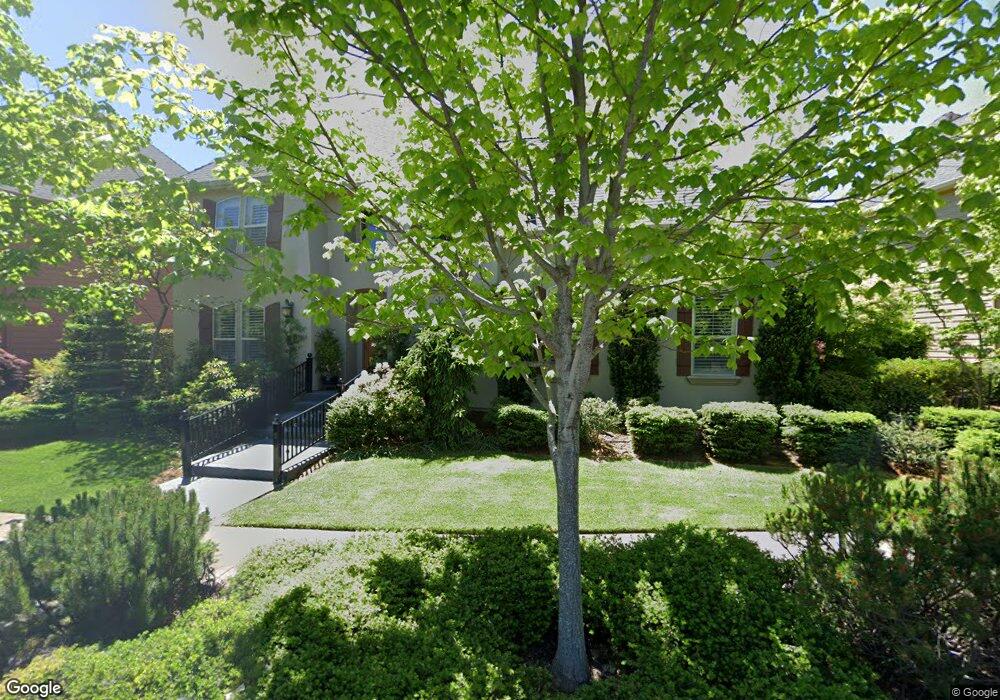
430 W Nevada St Unit 32 Ashland, OR 97520
Quiet Village NeighborhoodEstimated Value: $749,000 - $794,820
3
Beds
3
Baths
2,678
Sq Ft
$286/Sq Ft
Est. Value
About This Home
This home is located at 430 W Nevada St Unit 32, Ashland, OR 97520 and is currently estimated at $765,205, approximately $285 per square foot. 430 W Nevada St Unit 32 is a home located in Jackson County with nearby schools including Helman Elementary School, Ashland Middle School, and Ashland High School.
Ownership History
Date
Name
Owned For
Owner Type
Purchase Details
Closed on
Sep 17, 2007
Sold by
Deutsche Bank National Trust Co
Bought by
Larsen Richard H and Larsen Pamela W
Current Estimated Value
Home Financials for this Owner
Home Financials are based on the most recent Mortgage that was taken out on this home.
Original Mortgage
$417,000
Outstanding Balance
$264,557
Interest Rate
6.61%
Mortgage Type
Purchase Money Mortgage
Estimated Equity
$500,648
Purchase Details
Closed on
Mar 2, 2007
Sold by
Thurmond Mart and Thurmond Barbara
Bought by
Deutsche Bank National Trust Co and Argent Mortgage Securities Inc Asset Bac
Purchase Details
Closed on
Mar 3, 2006
Sold by
Thurmond Construction Inc
Bought by
Thurmond Mart and Thurmond Barbara
Home Financials for this Owner
Home Financials are based on the most recent Mortgage that was taken out on this home.
Original Mortgage
$468,300
Interest Rate
8.22%
Mortgage Type
Fannie Mae Freddie Mac
Purchase Details
Closed on
Mar 4, 2005
Sold by
Billings Ranch Golf Group Llc
Bought by
Thurmond Mart and Thurmond Barbara
Create a Home Valuation Report for This Property
The Home Valuation Report is an in-depth analysis detailing your home's value as well as a comparison with similar homes in the area
Home Values in the Area
Average Home Value in this Area
Purchase History
| Date | Buyer | Sale Price | Title Company |
|---|---|---|---|
| Larsen Richard H | $524,000 | Fa | |
| Deutsche Bank National Trust Co | $501,815 | None Available | |
| Thurmond Mart | -- | Lawyers Title Ins | |
| Thurmond Mart | $175,750 | Amerititle |
Source: Public Records
Mortgage History
| Date | Status | Borrower | Loan Amount |
|---|---|---|---|
| Open | Larsen Richard H | $417,000 | |
| Previous Owner | Thurmond Mart | $468,300 |
Source: Public Records
Tax History Compared to Growth
Tax History
| Year | Tax Paid | Tax Assessment Tax Assessment Total Assessment is a certain percentage of the fair market value that is determined by local assessors to be the total taxable value of land and additions on the property. | Land | Improvement |
|---|---|---|---|---|
| 2025 | $7,392 | $476,770 | $160,380 | $316,390 |
| 2024 | $7,392 | $462,890 | $155,710 | $307,180 |
| 2023 | $7,151 | $449,410 | $151,170 | $298,240 |
| 2022 | $6,922 | $449,410 | $151,170 | $298,240 |
| 2021 | $6,686 | $436,330 | $146,760 | $289,570 |
| 2020 | $6,499 | $423,630 | $142,490 | $281,140 |
| 2019 | $6,396 | $399,330 | $134,310 | $265,020 |
| 2018 | $6,042 | $387,700 | $130,400 | $257,300 |
| 2017 | $5,998 | $387,700 | $130,400 | $257,300 |
| 2016 | $5,842 | $365,450 | $122,920 | $242,530 |
| 2015 | $5,616 | $365,450 | $122,920 | $242,530 |
| 2014 | $5,434 | $344,480 | $115,860 | $228,620 |
Source: Public Records
Map
Nearby Homes
- 472 Lindsay Ln
- 662 Vansant St
- 566 Coffee Ln
- 364 Randy St
- 356 Randy St
- 242 Grant St
- 332 Randy St
- 230 Grant St
- 595 Elizabeth Ave
- 360 Coventry Place
- 720 Grover St
- 581 Scenic Dr Unit 9
- 317 Maple St
- 323 Glenn St Unit 6
- 311 Glenn St Unit 3
- 330 Glenn St
- 106 Dunn Cir
- 67 Woolen Way
- 111 Nursery St
- 451 N Main St
- 430 W Nevada St
- 420 W Nevada St Unit 33
- 420 W Nevada St
- 440 W Nevada St Unit 31
- 440 W Nevada St
- 472 Lindsay Ln Unit 37
- 410 W Nevada St
- 482 Lindsay Ln
- 435 W Nevada St Unit 4
- 435 W Nevada St
- 450 W Nevada St
- 462 Lindsay Lot # 38 Ln
- 445 W Nevada St Unit 5
- 445 W Nevada St
- 425 W Nevada St Unit 3
- 425 W Nevada St
- 462 Lindsay Ln
- 415 W Nevada St Unit 2
- 415 W Nevada St
- 455 W Nevada Unit 6