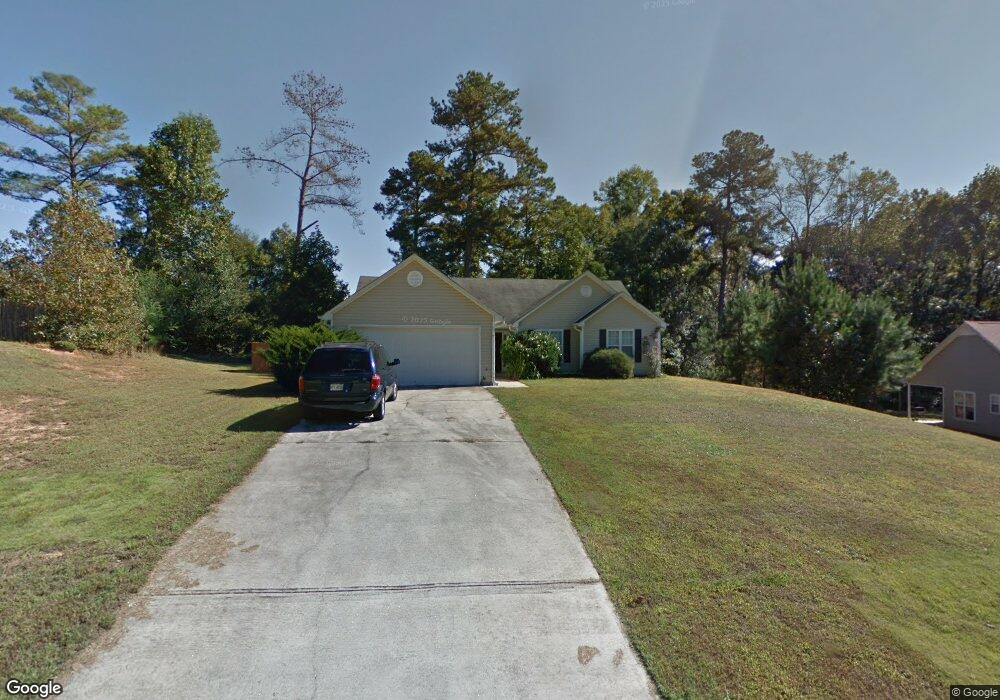
430 Wilmington Way Monroe, GA 30655
Estimated Value: $303,000 - $335,000
3
Beds
2
Baths
1,435
Sq Ft
$226/Sq Ft
Est. Value
About This Home
This home is located at 430 Wilmington Way, Monroe, GA 30655 and is currently estimated at $323,714, approximately $225 per square foot. 430 Wilmington Way is a home located in Walton County with nearby schools including Youth Elementary School, Youth Middle School, and Walnut Grove High School.
Ownership History
Date
Name
Owned For
Owner Type
Purchase Details
Closed on
Jul 22, 2011
Sold by
Hud-Housing Of Urban Dev
Bought by
French William and French Sonja
Current Estimated Value
Purchase Details
Closed on
Dec 7, 2010
Sold by
Wells Fargo Bk Na
Bought by
Hud-Housing Of Urban Dev
Purchase Details
Closed on
Aug 28, 2003
Sold by
Sanchez Israel
Bought by
Lopez Belva R
Home Financials for this Owner
Home Financials are based on the most recent Mortgage that was taken out on this home.
Original Mortgage
$121,049
Interest Rate
6.13%
Mortgage Type
FHA
Purchase Details
Closed on
Apr 6, 1999
Sold by
Jcd Entps Inc
Bought by
Krogh Keith A
Home Financials for this Owner
Home Financials are based on the most recent Mortgage that was taken out on this home.
Original Mortgage
$85,400
Interest Rate
7.08%
Mortgage Type
Purchase Money Mortgage
Create a Home Valuation Report for This Property
The Home Valuation Report is an in-depth analysis detailing your home's value as well as a comparison with similar homes in the area
Home Values in the Area
Average Home Value in this Area
Purchase History
| Date | Buyer | Sale Price | Title Company |
|---|---|---|---|
| French William | -- | -- | |
| Hud-Housing Of Urban Dev | -- | -- | |
| Wells Fargo Bk Na | $115,062 | -- | |
| Lopez Belva R | $123,000 | -- | |
| Krogh Keith A | $89,900 | -- |
Source: Public Records
Mortgage History
| Date | Status | Borrower | Loan Amount |
|---|---|---|---|
| Previous Owner | Lopez Belva R | $121,049 | |
| Previous Owner | Krogh Keith A | $85,400 |
Source: Public Records
Tax History Compared to Growth
Tax History
| Year | Tax Paid | Tax Assessment Tax Assessment Total Assessment is a certain percentage of the fair market value that is determined by local assessors to be the total taxable value of land and additions on the property. | Land | Improvement |
|---|---|---|---|---|
| 2024 | $3,271 | $108,920 | $21,200 | $87,720 |
| 2023 | $3,115 | $100,720 | $18,400 | $82,320 |
| 2022 | $2,641 | $81,640 | $14,400 | $67,240 |
| 2021 | $2,253 | $67,320 | $10,000 | $57,320 |
| 2020 | $2,116 | $61,520 | $10,000 | $51,520 |
| 2019 | $1,963 | $55,560 | $10,000 | $45,560 |
| 2018 | $1,908 | $55,560 | $10,000 | $45,560 |
| 2017 | $1,856 | $53,880 | $10,000 | $43,880 |
| 2016 | $1,586 | $45,240 | $10,000 | $35,240 |
| 2015 | $1,368 | $38,200 | $10,000 | $28,200 |
| 2014 | -- | $30,800 | $8,000 | $22,800 |
Source: Public Records
Map
Nearby Homes
- 304 Shenandoah Dr
- 841 Spring Creek Way
- (GA) The Bentley | Side Entry Plan at Spring Creek
- (GA)The Riley | Front Entry Plan at Spring Creek
- (GA)The Woodmont | Side Entry Plan at Spring Creek
- (GA)The Avondale | Front Entry Plan at Spring Creek
- (GA)The Kirkland | Front Entry Plan at Spring Creek
- The Wilmington Plan at Spring Creek
- (GA) The Brunswick | Front Entry Plan at Spring Creek
- (GA)The Emerson Ranch | Front Entry Plan at Spring Creek
- The Grayson Plan at Spring Creek
- The Hayden Plan at Spring Creek
- 609 Whiporwill Cove
- 1405 Willowbend Place
- 1401 Willowbend Place
- 1409 Willowbend Place
- 531 Ansley Forest Dr
- 2020 Highway 78
- 1436 Virginia Way
- 2476 Saint Martin Way
- 420 Wilmington Way
- 440 Wilmington Way
- 712 Charleston Ct
- 710 Charleston Ct
- 0 Wilmington Way
- 711 Charleston Ct
- 410 Wilmington Way Unit IV
- 2070 Nunnally Farm Rd Unit 1
- 2060 Nunnally Farm Rd
- 435 Wilmington Way
- 450 Wilmington Way Unit 4
- 2050 Nunnally Farm Rd Unit 1
- 2080 Nunnally Farm Rd Unit 1
- 415 Wilmington Way
- 708 Charleston Ct Unit 2
- 445 Wilmington Way
- 709 Charleston Ct
- 709 Charleston Ct Unit 5
- 2040 Nunnally Farm Rd
- 455 Wilmington Way