Estimated Value: $176,000 - $199,800
3
Beds
1
Bath
976
Sq Ft
$190/Sq Ft
Est. Value
About This Home
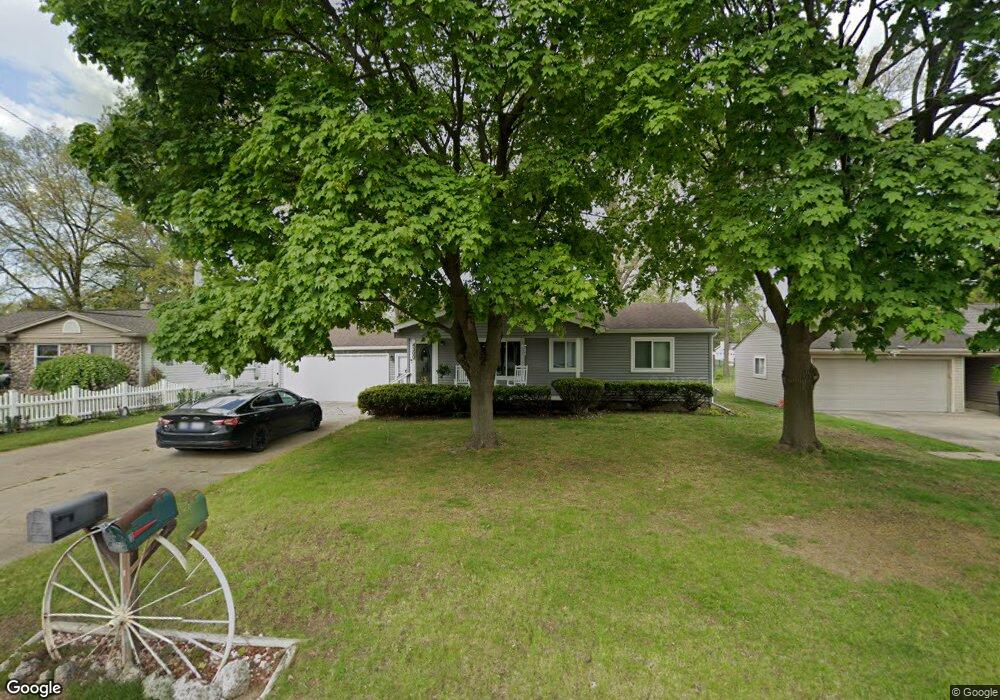
This home is located at 4300 Ashlawn Dr, Flint, MI 48507 and is currently estimated at $185,450, approximately $190 per square foot. 4300 Ashlawn Dr is a home located in Genesee County with nearby schools including Carman-Ainsworth High School.
Ownership History
Date
Name
Owned For
Owner Type
Purchase Details
Closed on
Oct 5, 2023
Sold by
Loy Cindy L and Loy William R
Bought by
Clapper Melanie and Polizzi Dillon
Current Estimated Value
Home Financials for this Owner
Home Financials are based on the most recent Mortgage that was taken out on this home.
Original Mortgage
$181,649
Outstanding Balance
$178,481
Interest Rate
7.75%
Mortgage Type
FHA
Estimated Equity
$6,969
Purchase Details
Closed on
Dec 3, 2010
Sold by
Loy Cindy L
Bought by
Loy Cindy L and Loy William R
Purchase Details
Closed on
Sep 21, 2010
Sold by
Secretary Of Housing & Urban Development
Bought by
Loy Cindy L
Purchase Details
Closed on
Aug 26, 2009
Sold by
National City Bank
Bought by
The Secretary Of Housing & Urban Develop
Purchase Details
Closed on
Jan 21, 2009
Sold by
Mooney Curt P
Bought by
National City Bank
Purchase Details
Closed on
Aug 28, 2001
Sold by
Chalut Edward G and Chalut Geanene M
Bought by
Mooney Curt P
Create a Home Valuation Report for This Property
The Home Valuation Report is an in-depth analysis detailing your home's value as well as a comparison with similar homes in the area
Home Values in the Area
Average Home Value in this Area
Purchase History
| Date | Buyer | Sale Price | Title Company |
|---|---|---|---|
| Clapper Melanie | $185,000 | Michigan Moves Title Agency | |
| Clapper Melanie | $185,000 | Michigan Moves Title Agency | |
| Loy Cindy L | -- | Sargents Title Company | |
| Loy Cindy L | $30,500 | None Available | |
| The Secretary Of Housing & Urban Develop | -- | None Available | |
| National City Bank | $111,992 | None Available | |
| Mooney Curt P | $119,900 | Sargents Title Company |
Source: Public Records
Mortgage History
| Date | Status | Borrower | Loan Amount |
|---|---|---|---|
| Open | Clapper Melanie | $181,649 | |
| Closed | Clapper Melanie | $181,649 |
Source: Public Records
Tax History Compared to Growth
Tax History
| Year | Tax Paid | Tax Assessment Tax Assessment Total Assessment is a certain percentage of the fair market value that is determined by local assessors to be the total taxable value of land and additions on the property. | Land | Improvement |
|---|---|---|---|---|
| 2025 | $2,822 | $74,000 | $0 | $0 |
| 2024 | $1,497 | $66,800 | $0 | $0 |
| 2023 | $1,943 | $65,900 | $0 | $0 |
| 2022 | $747 | $61,100 | $0 | $0 |
| 2021 | $2,094 | $52,100 | $0 | $0 |
| 2020 | $1,328 | $46,000 | $0 | $0 |
| 2019 | $1,311 | $37,500 | $0 | $0 |
| 2018 | $1,971 | $34,600 | $0 | $0 |
| 2017 | $1,902 | $34,600 | $0 | $0 |
| 2016 | $1,950 | $31,900 | $0 | $0 |
| 2015 | $1,773 | $31,600 | $0 | $0 |
| 2014 | $1,268 | $30,300 | $0 | $0 |
| 2012 | -- | $38,200 | $38,200 | $0 |
Source: Public Records
Map
Nearby Homes
- 1203 Pickwick Place
- 4480 Cherrytree Ln
- 1144 Pickwick Place
- 4505 Old Carriage Rd
- 1108 Trotwood Ln
- 1111 W Mclean Ave
- 1072 W Williamson Ave
- 1097 W Buder Ave
- 4460 Saint Martins Dr
- 1256 W Rowland St
- 1051 W Mclean Ave
- 1136 W Rowland St
- 1508 W Bristol Rd
- 4493 Fenton Rd
- 1044 W Rowland St
- 1247 Catalina Dr
- VACANT Green Briar Blvd
- 1130 Leisure Dr Unit 21
- 1380 Sunset Blvd
- Lot 57 Walnut Creek Dr
- 4308 Ashlawn Dr
- 4316 Ashlawn Dr
- 4284 Ashlawn Dr
- 4322 Ashlawn Dr
- 4307 Ashlawn Dr
- 1339 Hidden Oaks Ct
- 4333 Old Carriage Ct
- 4299 Ashlawn Dr
- 4315 Ashlawn Dr
- 4291 Ashlawn Dr
- 4335 Old Carriage Ct
- 4276 Ashlawn Dr
- 1337 Hidden Oaks Ct
- 1338 Hidden Oaks Ct
- 4277 Ashlawn Dr
- 4285 Ashlawn Dr
- 4331 Old Carriage Ct
- 4329 Ashlawn Dr
- 4270 Ashlawn Dr
- 4330 Ashlawn Dr