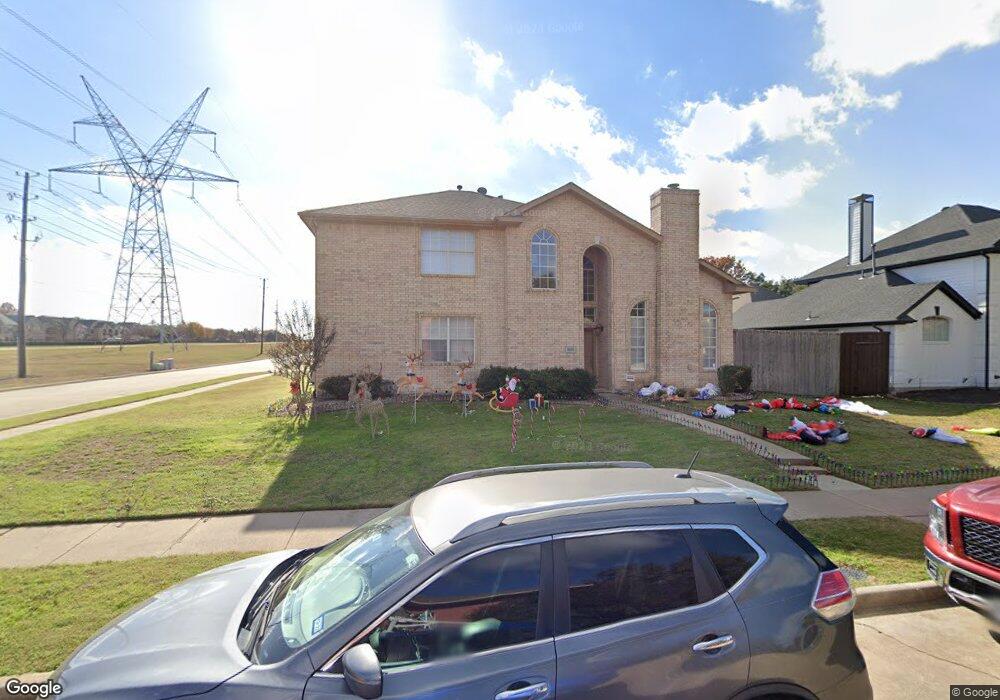
4300 Echo Bluff Dr Plano, TX 75024
Spring Creek NeighborhoodEstimated Value: $511,000 - $554,000
4
Beds
3
Baths
2,417
Sq Ft
$219/Sq Ft
Est. Value
About This Home
This home is located at 4300 Echo Bluff Dr, Plano, TX 75024 and is currently estimated at $529,880, approximately $219 per square foot. 4300 Echo Bluff Dr is a home located in Collin County with nearby schools including Gulledge Elementary School, Robinson Middle School, and Jasper High School.
Ownership History
Date
Name
Owned For
Owner Type
Purchase Details
Closed on
Dec 19, 2016
Sold by
Gray Steven
Bought by
Schlamowitz Jerold L and Robles Maribel
Current Estimated Value
Home Financials for this Owner
Home Financials are based on the most recent Mortgage that was taken out on this home.
Original Mortgage
$305,250
Outstanding Balance
$251,875
Interest Rate
4.25%
Mortgage Type
FHA
Estimated Equity
$278,005
Purchase Details
Closed on
May 4, 2004
Sold by
Cohen Michael and Cohen Natalie
Bought by
Gray Steven
Home Financials for this Owner
Home Financials are based on the most recent Mortgage that was taken out on this home.
Original Mortgage
$137,360
Interest Rate
5.99%
Mortgage Type
Purchase Money Mortgage
Purchase Details
Closed on
Aug 19, 1994
Sold by
Holigan Family Investments Inc
Bought by
Cohen Michael and Cohen Natalie
Home Financials for this Owner
Home Financials are based on the most recent Mortgage that was taken out on this home.
Original Mortgage
$178,500
Interest Rate
7%
Mortgage Type
Assumption
Create a Home Valuation Report for This Property
The Home Valuation Report is an in-depth analysis detailing your home's value as well as a comparison with similar homes in the area
Home Values in the Area
Average Home Value in this Area
Purchase History
| Date | Buyer | Sale Price | Title Company |
|---|---|---|---|
| Schlamowitz Jerold L | -- | Chicago Title | |
| Gray Steven | -- | Rtt | |
| Cohen Michael | -- | -- |
Source: Public Records
Mortgage History
| Date | Status | Borrower | Loan Amount |
|---|---|---|---|
| Open | Schlamowitz Jerold L | $305,250 | |
| Previous Owner | Gray Steven | $137,360 | |
| Previous Owner | Cohen Michael | $178,500 |
Source: Public Records
Tax History Compared to Growth
Tax History
| Year | Tax Paid | Tax Assessment Tax Assessment Total Assessment is a certain percentage of the fair market value that is determined by local assessors to be the total taxable value of land and additions on the property. | Land | Improvement |
|---|---|---|---|---|
| 2025 | $5,890 | $490,182 | $147,250 | $342,932 |
| 2024 | $5,890 | $464,291 | $147,250 | $337,400 |
| 2023 | $5,890 | $422,083 | $139,500 | $312,050 |
| 2022 | $7,333 | $383,712 | $112,500 | $319,391 |
| 2021 | $7,034 | $348,829 | $94,500 | $254,329 |
| 2020 | $6,482 | $317,482 | $81,000 | $236,482 |
| 2019 | $7,427 | $343,643 | $81,000 | $262,643 |
| 2018 | $7,245 | $332,393 | $81,000 | $251,393 |
| 2017 | $6,700 | $307,377 | $72,000 | $235,377 |
| 2016 | $5,423 | $254,630 | $72,000 | $182,630 |
| 2015 | $4,187 | $223,341 | $58,500 | $164,841 |
Source: Public Records
Map
Nearby Homes
- 4308 Echo Bluff Dr
- 6404 Meadowview Ct
- 4317 Crown Ridge Dr
- 4413 Crown Ridge Dr
- 4252 Winding Brook Dr
- 4232 Sun Creek Ct
- 6413 Townsend Ln
- 4116 Pinewood Dr
- 6504 Castille Ct
- 6720 Grant Ln
- 6614 Phoenix Place
- 6740 Magnum Dr
- 4412 Saber Ct
- 3908 Denham Way
- 4100 Lorimar Dr
- 4001 Elmhill Dr
- 4617 Glenrose Way
- 6713 Windham Way
- 6741 Biltmore Place
- 4628 Putnam Dr
- 4304 Echo Bluff Dr
- 4301 Crown Ridge Dr
- 4305 Crown Ridge Dr
- 6400 Meadowview Ct
- 4309 Crown Ridge Dr
- 6401 Meadowview Ct
- 4312 Echo Bluff Dr
- 4313 Crown Ridge Dr
- 6405 Meadowview Ct
- 4300 Crown Ridge Dr
- 4304 Crown Ridge Dr
- 4316 Echo Bluff Dr
- 6400 Pavillion Ct
- 6408 Meadowview Ct
- 4308 Crown Ridge Dr
- 6409 Meadowview Ct
- 6404 Pavillion Ct
- 4312 Crown Ridge Dr
- 4400 Echo Bluff Dr
- 4401 Crown Ridge Dr