4300 Inverness Ct NE Unit 1 Roswell, GA 30075
East Cobb NeighborhoodEstimated payment $3,109/month
Highlights
- Open-Concept Dining Room
- Community Lake
- Wood Burning Stove
- Garrison Mill Elementary School Rated A
- Deck
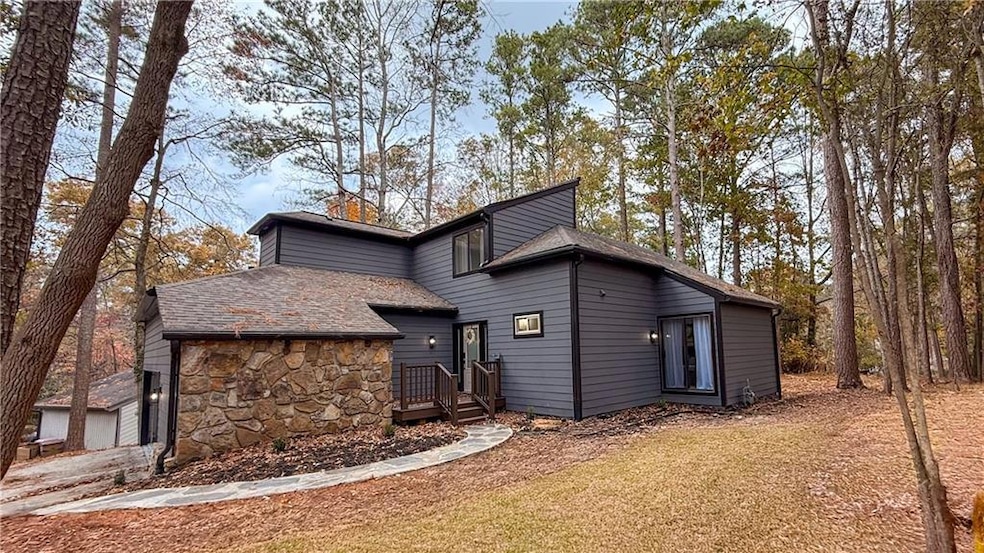
- Contemporary Architecture
About This Home
Discover the lifestyle of Loch Highland, one of Roswell’s most desirable lake communities, known for its peaceful water views, mature trees, and resort-style amenities. Enjoy two lakeside swimming pools, tennis courts, a playground, clubhouse, and scenic walking areas that make everyday living feel like a retreat.
Nestled on a quiet cul-de-sac with a Roswell address and Cobb County taxes, this move-in ready home offers quick access to Roswell parks, trails, shopping, dining, and top-rated schools—Garrison Mill ES, Mabry MS, and Lassiter HS. You’re also just minutes from Mabry Park and Roswell Area Park, perfect for outdoor activities, playgrounds, hiking, and dog-friendly adventures.
Inside, the warm Contemporary-Traditional design features vaulted ceilings, an exposed beam, and a spacious living room with a gas-starter fireplace. The primary suite on the main level provides privacy and convenience. The updated kitchen includes new white cabinets, new quartz countertops, a new kitchen island, and a gas range with hood, ideal for modern living and entertaining.
Upstairs, two additional bedrooms and a full bath offer flexible space for family, guests, or a home office. The home has been extensively updated with new plumbing fixtures, new lighting, new water heater, new toilets, new flooring, new carpet, new appliances, new garage doors, and fresh interior and exterior paint, ensuring long-term durability and curb appeal. This beautifully updated Roswell home in Loch Highland offers the wooded privacy, amenities, and school district buyers are searching for. Schedule your private showing today. We speak English and Spanish / Hablamos español e inglés.

Home Details
Home Type
- Single Family
Est. Annual Taxes
- $884
Year Built
- Built in 1976 | Remodeled
Lot Details
- 10,768 Sq Ft Lot
- Lot Dimensions are 97 x 111
- Cul-De-Sac
- Corner Lot
HOA Fees
- $83 Monthly HOA Fees
Parking
- 2 Car Attached Garage
- Parking Accessed On Kitchen Level
- Side Facing Garage
- Garage Door Opener
- Driveway
Home Design
- Contemporary Architecture
- Traditional Architecture
- Block Foundation
- Shingle Roof
- Composition Roof
- Stone Siding
- HardiePlank Type
Interior Spaces
- 1,830 Sq Ft Home
- 2-Story Property
- Beamed Ceilings
- Vaulted Ceiling
- Ceiling Fan
- Wood Burning Stove
- Gas Log Fireplace
- Living Room with Fireplace
- Open-Concept Dining Room
- Carpet
- Neighborhood Views
- Crawl Space
- Laundry on main level
Kitchen
- Breakfast Bar
- Gas Range
- Range Hood
- Dishwasher
- Kitchen Island
- Stone Countertops
- White Kitchen Cabinets
Bedrooms and Bathrooms
- 3 Bedrooms | 1 Primary Bedroom on Main
- Walk-In Closet
- Vaulted Bathroom Ceilings
- Dual Vanity Sinks in Primary Bathroom
- Shower Only
Home Security
- Carbon Monoxide Detectors
- Fire and Smoke Detector
Outdoor Features
- Deck
- Rain Gutters
- Front Porch
Location
- Property is near schools
- Property is near shops
Schools
- Garrison Mill Elementary School
- Mabry Middle School
- Lassiter High School
Utilities
- Central Heating and Cooling System
- Heating System Uses Natural Gas
- 110 Volts
- Phone Available
Listing and Financial Details
- Assessor Parcel Number 16025400580
Community Details
Overview
- Loch Highland Subdivision
- Community Lake
Recreation
- Tennis Courts
- Community Pool
- Trails
Map
Home Values in the Area
Average Home Value in this Area
Tax History
| Year | Tax Paid | Tax Assessment Tax Assessment Total Assessment is a certain percentage of the fair market value that is determined by local assessors to be the total taxable value of land and additions on the property. | Land | Improvement |
|---|---|---|---|---|
| 2025 | $884 | $174,732 | $56,000 | $118,732 |
| 2024 | $865 | $167,368 | $44,000 | $123,368 |
| 2023 | $659 | $167,368 | $44,000 | $123,368 |
| 2022 | $791 | $142,344 | $36,000 | $106,344 |
| 2021 | $713 | $116,284 | $36,000 | $80,284 |
| 2020 | $713 | $116,284 | $36,000 | $80,284 |
| 2019 | $686 | $107,336 | $28,000 | $79,336 |
| 2018 | $686 | $107,336 | $28,000 | $79,336 |
| 2017 | $623 | $107,336 | $28,000 | $79,336 |
| 2016 | $1,916 | $82,292 | $28,000 | $54,292 |
| 2015 | $1,957 | $82,292 | $28,000 | $54,292 |
| 2014 | $1,853 | $77,104 | $0 | $0 |
Purchase History
| Date | Type | Sale Price | Title Company |
|---|---|---|---|
| Special Warranty Deed | $375,000 | Titles Inked | |
| Deed | $118,000 | -- |
Mortgage History
| Date | Status | Loan Amount | Loan Type |
|---|---|---|---|
| Open | $397,500 | Construction |
Source: First Multiple Listing Service (FMLS)
MLS Number: 7680782
APN: 16-0254-0-058-0
Disclaimer: Certain information contained herein is derived from information provided by parties other than Homes.com. All information provided is deemed reliable, but is not guaranteed to be accurate and should be independently verified.
![]() Listings identified with the FMLS IDX logo come from FMLS and are held by brokerage firms other than the owner of this website. The listing brokerage is identified in any listing details. Information is deemed reliable but is not guaranteed. If you believe any FMLS listing contains material that infringes your copyrighted work please visit www.fmls.com/dmca to review our DMCA policy and learn how to submit a takedown request. © 2025 First Multiple Listing Service, Inc.
Listings identified with the FMLS IDX logo come from FMLS and are held by brokerage firms other than the owner of this website. The listing brokerage is identified in any listing details. Information is deemed reliable but is not guaranteed. If you believe any FMLS listing contains material that infringes your copyrighted work please visit www.fmls.com/dmca to review our DMCA policy and learn how to submit a takedown request. © 2025 First Multiple Listing Service, Inc.
- 3985 Loch Highland Pass NE
- 4440 Coventry Ct NE
- 3865 Mabry Rd NE
- 4209 Loch Highland Pkwy NE
- 3760 Loch Highland Pkwy NE
- 4509 Bastion Dr
- 4505 Bastion Dr
- 4274 Loch Highland Pkwy NE
- 4587 Gilhams Rd NE
- 3990 Wesley Chapel Rd
- 4579 Glenforest Dr NE
- 3810 Galloway Dr NE
- 4022 Wesley Chapel Rd
- 4032 Wesley Chapel Rd
- 3935 Chapel Heights Dr
- 4019 Wesley Chapel Rd
- 4361 Old Mabry Ln NE
- 3980 Rock Mill Pkwy
- 1580 Jones Rd Unit Cottage 1
- 3747 Running Fox Dr
- 3450 Ellenwood Ct NE
- 265 Shady Marsh Trail Unit B
- 3285 Marlanta Dr Unit Beautiful East Cobb Unit
- 3285 Marlanta Dr
- 3765 Cochran Lake Dr
- 4536 Mountain Creek Dr NE
- 3345 Holliglen Dr
- 3250 Ethan Dr
- 3110 Skyridge Ct
- 4640 Mountain Creek Dr NE
- 10565 Shallowford Rd
- 2862 Clary Hill Dr NE
- 7605 Lowery Oak Dr
- 375 Crider Ct Unit A
- 243 Witter Way
- 2646 Alpine Trail
- 2575 Walden Estates Dr