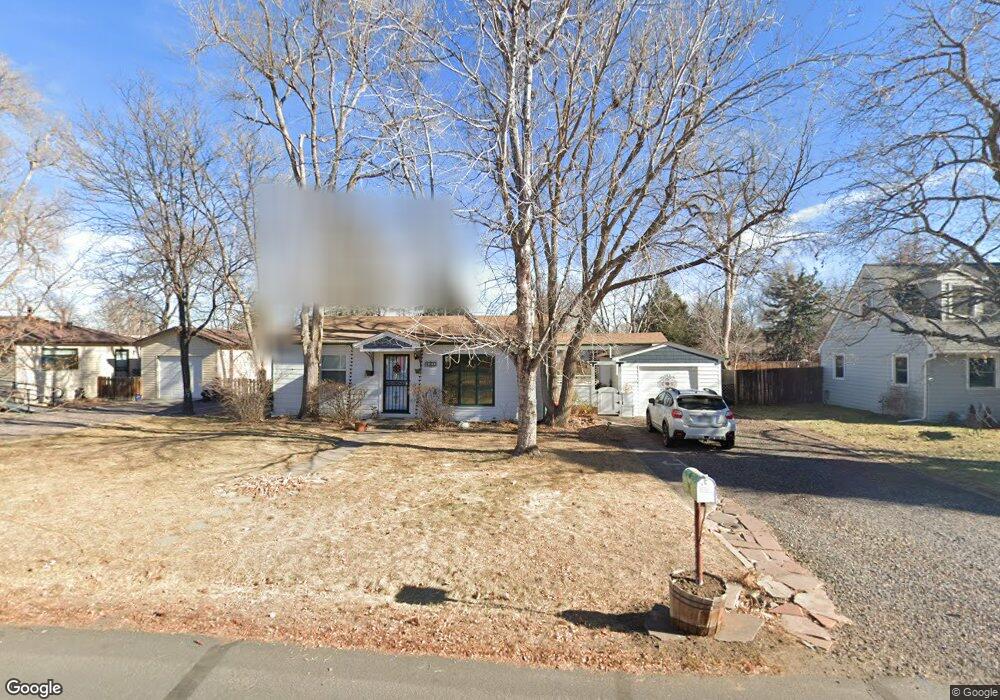
4300 Iris St Wheat Ridge, CO 80033
Kipling NeighborhoodEstimated Value: $420,043 - $488,000
2
Beds
1
Bath
792
Sq Ft
$581/Sq Ft
Est. Value
About This Home
This home is located at 4300 Iris St, Wheat Ridge, CO 80033 and is currently estimated at $460,511, approximately $581 per square foot. 4300 Iris St is a home located in Jefferson County with nearby schools including Peak Expeditionary - Pennington, Everitt Middle School, and Wheat Ridge High School.
Ownership History
Date
Name
Owned For
Owner Type
Purchase Details
Closed on
Oct 21, 2020
Sold by
Oconnor Shelia Marie
Bought by
Snyder Brett Elizabeth
Current Estimated Value
Purchase Details
Closed on
Jun 25, 2004
Sold by
Draper Dorothy Athelia
Bought by
Oconnor Sheila Marie
Home Financials for this Owner
Home Financials are based on the most recent Mortgage that was taken out on this home.
Original Mortgage
$137,840
Interest Rate
5.5%
Mortgage Type
Purchase Money Mortgage
Purchase Details
Closed on
May 20, 2004
Sold by
Draper Douglas Wesley
Bought by
Draper Dorothy Athelia
Home Financials for this Owner
Home Financials are based on the most recent Mortgage that was taken out on this home.
Original Mortgage
$137,840
Interest Rate
5.5%
Mortgage Type
Purchase Money Mortgage
Purchase Details
Closed on
Oct 19, 1995
Sold by
Draper Douglas Wesley
Bought by
Draper Dorothy Athelia
Create a Home Valuation Report for This Property
The Home Valuation Report is an in-depth analysis detailing your home's value as well as a comparison with similar homes in the area
Home Values in the Area
Average Home Value in this Area
Purchase History
| Date | Buyer | Sale Price | Title Company |
|---|---|---|---|
| Snyder Brett Elizabeth | $389,500 | First American Title | |
| Oconnor Sheila Marie | $172,300 | Stgco | |
| Draper Dorothy Athelia | -- | -- | |
| Draper Dorothy Athelia | -- | -- |
Source: Public Records
Mortgage History
| Date | Status | Borrower | Loan Amount |
|---|---|---|---|
| Previous Owner | Oconnor Sheila Marie | $137,840 | |
| Closed | Oconnor Sheila Marie | $25,845 |
Source: Public Records
Tax History
| Year | Tax Paid | Tax Assessment Tax Assessment Total Assessment is a certain percentage of the fair market value that is determined by local assessors to be the total taxable value of land and additions on the property. | Land | Improvement |
|---|---|---|---|---|
| 2024 | $2,346 | $25,307 | $17,296 | $8,011 |
| 2023 | $2,346 | $25,307 | $17,296 | $8,011 |
| 2022 | $1,987 | $21,328 | $11,550 | $9,778 |
| 2021 | $2,016 | $21,941 | $11,882 | $10,059 |
| 2020 | $1,877 | $20,469 | $9,998 | $10,471 |
| 2019 | $1,851 | $20,469 | $9,998 | $10,471 |
| 2018 | $1,638 | $17,611 | $7,318 | $10,293 |
| 2017 | $1,492 | $17,611 | $7,318 | $10,293 |
| 2016 | $1,256 | $13,885 | $6,092 | $7,793 |
| 2015 | $967 | $13,885 | $6,092 | $7,793 |
| 2014 | $967 | $10,053 | $5,158 | $4,895 |
Source: Public Records
Map
Nearby Homes
- 4324 Hoyt St
- 4500 Hoyt St
- 9870 W 41st Ave
- 4643 Independence St Unit 9
- 10095 W 41st Ave
- 9041 W 45th Place
- 10251 W 44th Ave Unit 5-208
- 10251 W 44th Ave Unit 6-106
- 10251 W 44th Ave Unit 2-105
- 10251 W 44th Ave Unit 7-108
- 3800 Independence Ct
- 4676 Flower St Unit 4676
- 4062 Lee Cir
- 4709 Flower St Unit 4709
- 3816 Independence Ct
- 9800 W 38th Ave
- 4184 Everett Dr
- 8793 W 46th Ave
- 9380 W 49th Ave Unit 107
- 9380 W 49th Ave Unit 101
Your Personal Tour Guide
Ask me questions while you tour the home.