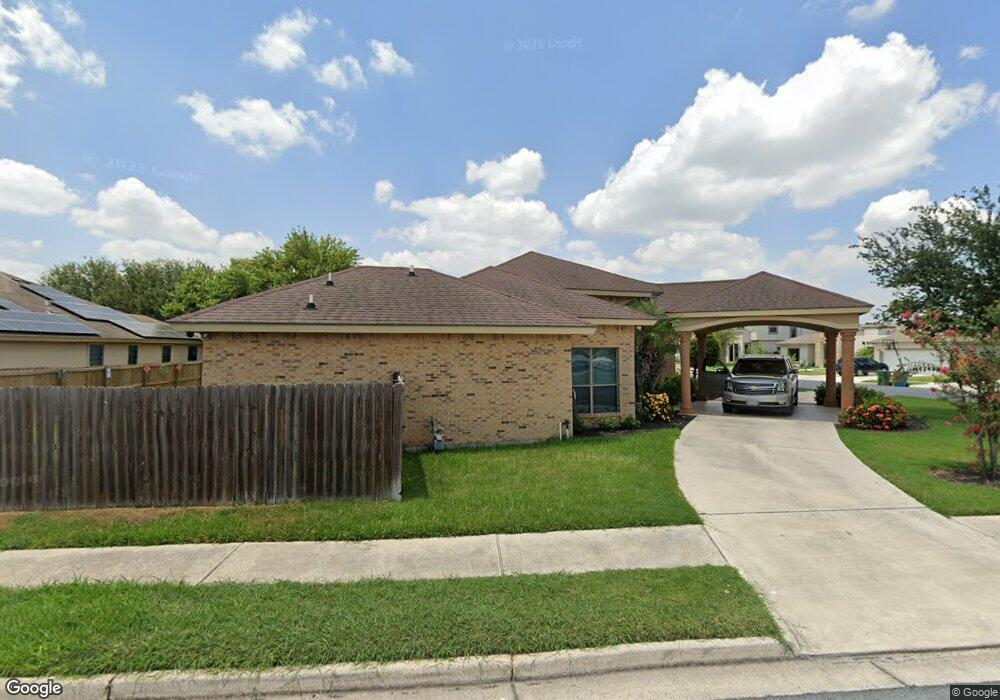
4300 Travis Lake Ct Brownsville, TX 78520
Estimated Value: $392,506 - $500,000
4
Beds
4
Baths
2,637
Sq Ft
$173/Sq Ft
Est. Value
About This Home
This home is located at 4300 Travis Lake Ct, Brownsville, TX 78520 and is currently estimated at $455,627, approximately $172 per square foot. 4300 Travis Lake Ct is a home located in Cameron County with nearby schools including Villareal Elementary School, Resaca Middle School, and Los Fresnos United.
Ownership History
Date
Name
Owned For
Owner Type
Purchase Details
Closed on
Aug 17, 2013
Sold by
Secretary Of Hud
Bought by
Guess Mark Allan and Guess Maria
Current Estimated Value
Home Financials for this Owner
Home Financials are based on the most recent Mortgage that was taken out on this home.
Original Mortgage
$213,069
Outstanding Balance
$159,145
Interest Rate
4.5%
Mortgage Type
FHA
Estimated Equity
$296,482
Purchase Details
Closed on
Feb 19, 2013
Sold by
Bank Of America Na
Bought by
Secretary Of Hud
Purchase Details
Closed on
Feb 12, 2013
Sold by
Ansari Zahid R
Bought by
Bank Of America Na
Purchase Details
Closed on
Jul 23, 2007
Sold by
Pesquera Investments Lp
Bought by
Ansari Zahid R
Home Financials for this Owner
Home Financials are based on the most recent Mortgage that was taken out on this home.
Original Mortgage
$27,500
Interest Rate
6.73%
Create a Home Valuation Report for This Property
The Home Valuation Report is an in-depth analysis detailing your home's value as well as a comparison with similar homes in the area
Home Values in the Area
Average Home Value in this Area
Purchase History
| Date | Buyer | Sale Price | Title Company |
|---|---|---|---|
| Guess Mark Allan | -- | San Jacinto Title Services | |
| Secretary Of Hud | -- | None Available | |
| Bank Of America Na | $252,168 | None Available | |
| Ansari Zahid R | -- | Landtitleusa Inc |
Source: Public Records
Mortgage History
| Date | Status | Borrower | Loan Amount |
|---|---|---|---|
| Open | Guess Mark Allan | $213,069 | |
| Previous Owner | Ansari Zahid R | $27,500 |
Source: Public Records
Tax History Compared to Growth
Tax History
| Year | Tax Paid | Tax Assessment Tax Assessment Total Assessment is a certain percentage of the fair market value that is determined by local assessors to be the total taxable value of land and additions on the property. | Land | Improvement |
|---|---|---|---|---|
| 2025 | $6,934 | $404,078 | -- | -- |
| 2024 | $6,934 | $367,344 | -- | -- |
| 2023 | $7,227 | $333,949 | $0 | $0 |
| 2022 | $7,585 | $303,590 | $46,000 | $257,590 |
| 2021 | $7,937 | $306,322 | $46,000 | $260,322 |
| 2020 | $7,820 | $300,058 | $37,000 | $263,058 |
| 2019 | $7,836 | $302,790 | $37,000 | $265,790 |
| 2018 | $7,885 | $305,523 | $37,000 | $268,523 |
| 2017 | $7,929 | $308,256 | $37,000 | $271,256 |
| 2016 | $7,999 | $310,990 | $37,000 | $273,990 |
| 2015 | $7,537 | $310,473 | $33,750 | $276,723 |
Source: Public Records
Map
Nearby Homes
- 4045 Lake View Dr
- 3096 W Lake Ave Unit 7,20
- 4823 Lakeway Dr
- 1708 Deep Spring St
- 1974 Royal Oak St
- 3515 Heritage Cir Unit LOT 10 & 11
- 1809 Royal Oak St
- 2822 W Alton Gloor Blvd
- 1920 Royal Oak St
- 2400 Firenze St
- 2500 Windsor Place
- 2720 Mayorca St
- 2848 Riviera St
- 2764 Cairo St
- TBD Beach Dunes Lot 21
- 3516 Hidalgo Cir Unit LOT 1 BLK 4
- 3604 Hidalgo Cir Unit LOT 1 BLK 6
- 0 W Alton Gloor Blvd
- N/A Stream Ct
- 3568 Simmons Place Ct
- 12 Lake View Dr
- 0 Lake View Dr Unit 29662153
- L-22 Lake View Dr
- L-23 Lake View Dr
- 000 Lake View Dr
- 16 Lake View Dr
- 17 Lake View Dr
- 37 Travis Lake Ct
- 10 Lake View Dr
- 20 Lake View Dr
- 0 Lake View Dr
- 4053 Lake View Dr
- 4060 Lake View Dr
- 4064 Lake View Dr
- 4304 Travis Lake Ct
- 4056 Lake View Dr
- 4401 Tahoe Lake Dr
- 4052 Lake View Dr
- 4305 Travis Lake Ct
- 4068 Lake View Dr