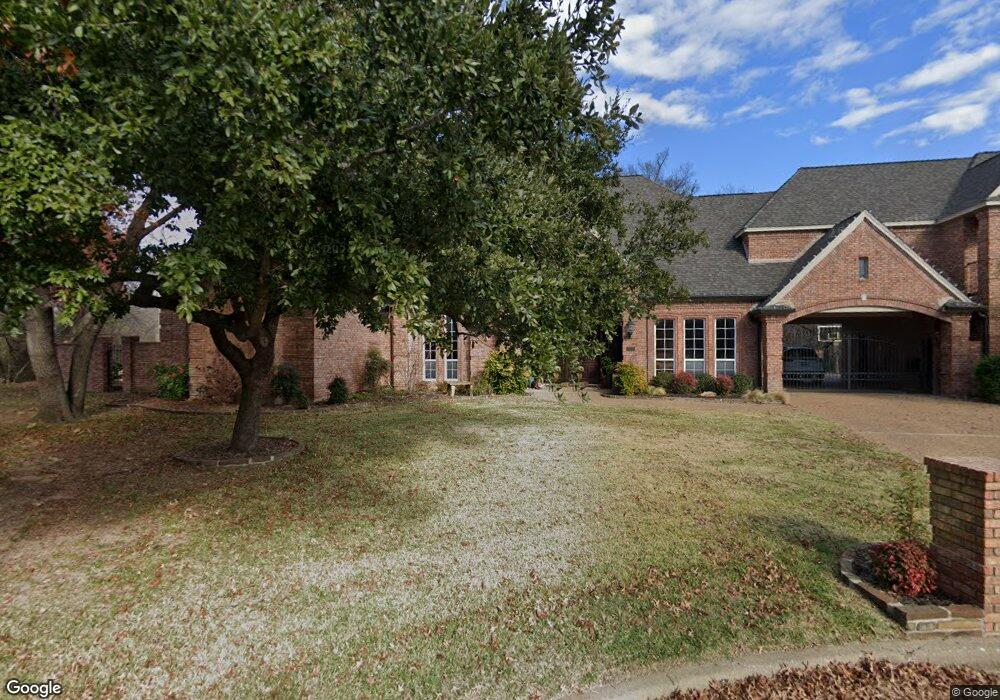
4301 Hidden Valley Ct Colleyville, TX 76034
Estimated Value: $1,170,000 - $1,388,000
4
Beds
5
Baths
5,536
Sq Ft
$234/Sq Ft
Est. Value
About This Home
This home is located at 4301 Hidden Valley Ct, Colleyville, TX 76034 and is currently estimated at $1,294,511, approximately $233 per square foot. 4301 Hidden Valley Ct is a home located in Tarrant County with nearby schools including Bransford Elementary School, Colleyville Middle School, and Grapevine High School.
Ownership History
Date
Name
Owned For
Owner Type
Purchase Details
Closed on
Jul 24, 2019
Sold by
Wallace Glenn R and Wallace Amanda L
Bought by
Lewis Wallace Glenn Ray and Lewis Wallace Amanda Jo
Current Estimated Value
Purchase Details
Closed on
Jun 20, 2012
Sold by
Wickman Butler Susan Mcferrin
Bought by
Wallace Glen R and Wallace Amanda L
Home Financials for this Owner
Home Financials are based on the most recent Mortgage that was taken out on this home.
Original Mortgage
$415,000
Outstanding Balance
$287,340
Interest Rate
3.81%
Mortgage Type
New Conventional
Estimated Equity
$1,007,171
Purchase Details
Closed on
Feb 2, 2009
Sold by
Butler Donald Stanley
Bought by
Butler Susan Mcferrin Wickman
Purchase Details
Closed on
Apr 25, 2001
Sold by
Butler Donald S
Bought by
Braswell Mike and Braswell Jane
Create a Home Valuation Report for This Property
The Home Valuation Report is an in-depth analysis detailing your home's value as well as a comparison with similar homes in the area
Home Values in the Area
Average Home Value in this Area
Purchase History
| Date | Buyer | Sale Price | Title Company |
|---|---|---|---|
| Lewis Wallace Glenn Ray | -- | None Available | |
| Wallace Glen R | -- | None Available | |
| Butler Susan Mcferrin Wickman | -- | None Available | |
| Braswell Mike | -- | American Title Co |
Source: Public Records
Mortgage History
| Date | Status | Borrower | Loan Amount |
|---|---|---|---|
| Open | Wallace Glen R | $415,000 |
Source: Public Records
Tax History Compared to Growth
Tax History
| Year | Tax Paid | Tax Assessment Tax Assessment Total Assessment is a certain percentage of the fair market value that is determined by local assessors to be the total taxable value of land and additions on the property. | Land | Improvement |
|---|---|---|---|---|
| 2025 | $4,116 | $1,289,796 | $333,556 | $956,240 |
| 2024 | $4,116 | $1,289,796 | $333,556 | $956,240 |
| 2023 | $15,502 | $945,000 | $333,556 | $611,444 |
| 2022 | $16,500 | $915,087 | $333,556 | $581,531 |
| 2021 | $16,678 | $880,444 | $229,612 | $650,832 |
| 2020 | $15,342 | $839,388 | $229,612 | $609,776 |
| 2019 | $14,511 | $773,025 | $125,000 | $648,025 |
| 2018 | $3,392 | $570,600 | $112,500 | $458,100 |
| 2017 | $13,480 | $570,600 | $112,500 | $458,100 |
| 2016 | $13,253 | $561,000 | $112,500 | $448,500 |
| 2015 | $13,732 | $601,100 | $68,750 | $532,350 |
| 2014 | $13,732 | $601,100 | $68,750 | $532,350 |
Source: Public Records
Map
Nearby Homes
- 4105 Inwood Ln
- 4600 Westbury Dr
- 4516 Dartmoore Ln
- 4600 Bransford Rd
- 1104 Garry Lynne Dr
- 4002 Copperwood Ct
- 628 Huntwich Dr
- 3907 Copperwood Ct
- 4812 Carmel Place
- 1921 Maplewood Trail
- 909 Brestol Ct W
- 4600 Stafford Dr
- 1303 Crest Dr
- 5104 Shadowood Rd
- 2116 Cottage Oak Ln
- 37 Piazza Ln
- 1421 Plantation Dr N
- 34 Piazza Ln Unit 37
- 3624 Wayne Ct
- 114 Glade Rd
- 4300 Hidden Valley Ct
- 4303 Hidden Valley Ct
- 4302 Hidden Valley Ct
- 4305 Hidden Valley Ct
- 4304 Hidden Valley Ct
- 900 Saddlebrook Dr
- 4306 Hidden Valley Ct
- 902 Saddlebrook Dr
- 714 Saddlebrook Dr
- 706 Green Meadow St N
- 801 Saddlebrook Dr
- 704 Green Meadow St N
- 901 Saddlebrook Dr
- 904 Saddlebrook Dr
- 702 Green Meadow St N
- 803 Hunters Glen Ct
- 4205 Wilcrest Ct
- 4300 Shadow Ridge Dr
- 4203 Wilcrest Ct
- 4302 Chimney Rock Ct