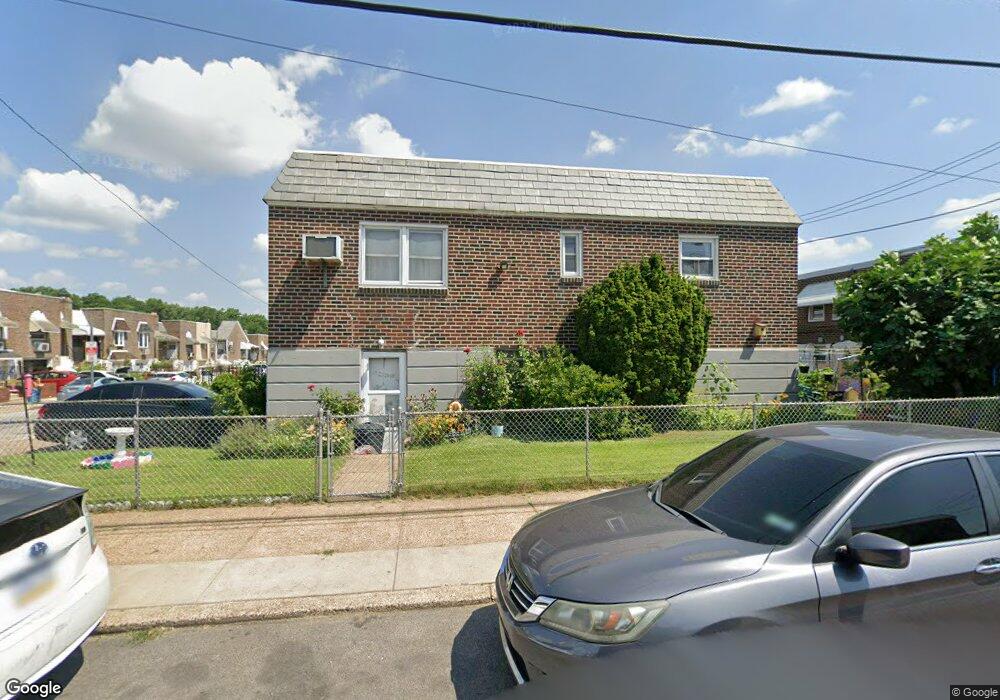
4301 Howland St Philadelphia, PA 19124
Juniata Park NeighborhoodEstimated Value: $176,862 - $204,000
2
Beds
2
Baths
720
Sq Ft
$262/Sq Ft
Est. Value
About This Home
This home is located at 4301 Howland St, Philadelphia, PA 19124 and is currently estimated at $188,716, approximately $262 per square foot. 4301 Howland St is a home located in Philadelphia County with nearby schools including Frankford High School, Community Academy of Philadelphia CS, and Mariana Bracetti Academy Cs.
Ownership History
Date
Name
Owned For
Owner Type
Purchase Details
Closed on
Dec 21, 2021
Sold by
Natalie Santiago
Bought by
Martinez Margarita
Current Estimated Value
Purchase Details
Closed on
Feb 27, 2008
Sold by
Hart Elfrieda M
Bought by
Santiago Natalie
Home Financials for this Owner
Home Financials are based on the most recent Mortgage that was taken out on this home.
Original Mortgage
$87,200
Interest Rate
5.57%
Mortgage Type
Purchase Money Mortgage
Create a Home Valuation Report for This Property
The Home Valuation Report is an in-depth analysis detailing your home's value as well as a comparison with similar homes in the area
Home Values in the Area
Average Home Value in this Area
Purchase History
| Date | Buyer | Sale Price | Title Company |
|---|---|---|---|
| Martinez Margarita | -- | None Listed On Document | |
| Santiago Natalie | $109,000 | First American Title Ins Co |
Source: Public Records
Mortgage History
| Date | Status | Borrower | Loan Amount |
|---|---|---|---|
| Previous Owner | Santiago Natalie | $87,200 |
Source: Public Records
Tax History Compared to Growth
Tax History
| Year | Tax Paid | Tax Assessment Tax Assessment Total Assessment is a certain percentage of the fair market value that is determined by local assessors to be the total taxable value of land and additions on the property. | Land | Improvement |
|---|---|---|---|---|
| 2025 | $2,019 | $159,800 | $31,960 | $127,840 |
| 2024 | $2,019 | $159,800 | $31,960 | $127,840 |
| 2023 | $2,019 | $144,200 | $28,840 | $115,360 |
| 2022 | $764 | $99,200 | $28,840 | $70,360 |
| 2021 | $1,394 | $0 | $0 | $0 |
| 2020 | $1,394 | $0 | $0 | $0 |
| 2019 | $1,295 | $0 | $0 | $0 |
| 2018 | $798 | $0 | $0 | $0 |
| 2017 | $1,218 | $0 | $0 | $0 |
| 2016 | $798 | $0 | $0 | $0 |
| 2015 | $764 | $0 | $0 | $0 |
| 2014 | -- | $87,000 | $24,416 | $62,584 |
| 2012 | -- | $12,640 | $2,353 | $10,287 |
Source: Public Records
Map
Nearby Homes