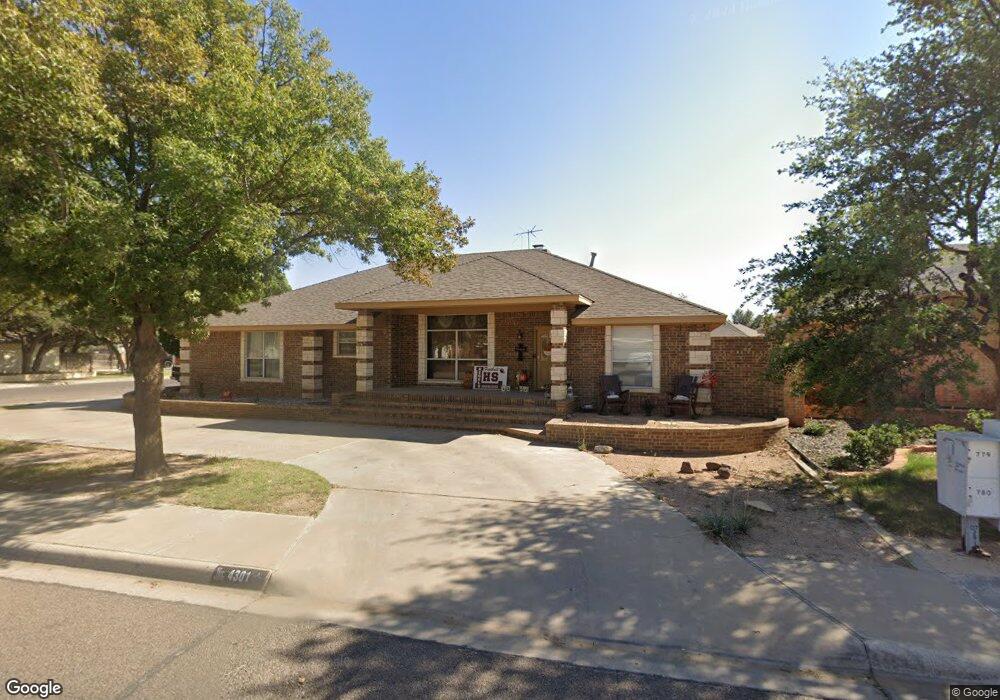
4301 Lehigh Dr Midland, TX 79707
Skyline Terrace NeighborhoodEstimated Value: $450,000 - $509,000
--
Bed
2
Baths
2,483
Sq Ft
$191/Sq Ft
Est. Value
About This Home
This home is located at 4301 Lehigh Dr, Midland, TX 79707 and is currently estimated at $473,842, approximately $190 per square foot. 4301 Lehigh Dr is a home located in Midland County with nearby schools including Parker Elementary School, Alamo Junior High School, and Trinity School of Midland.
Ownership History
Date
Name
Owned For
Owner Type
Purchase Details
Closed on
Mar 25, 2009
Sold by
Cosner Financial Group Lp
Bought by
Maltos Jose L and Maltos Cecilia
Current Estimated Value
Home Financials for this Owner
Home Financials are based on the most recent Mortgage that was taken out on this home.
Original Mortgage
$180,000
Interest Rate
5.21%
Mortgage Type
Purchase Money Mortgage
Purchase Details
Closed on
May 1, 2006
Sold by
Hollis Neil B
Bought by
The Cosner Financial Group Lp
Home Financials for this Owner
Home Financials are based on the most recent Mortgage that was taken out on this home.
Original Mortgage
$140,000
Interest Rate
6.32%
Mortgage Type
Purchase Money Mortgage
Purchase Details
Closed on
Apr 1, 1991
Bought by
Maltos Jose L
Purchase Details
Closed on
Nov 1, 1990
Bought by
Maltos Jose L
Purchase Details
Closed on
Jul 11, 1990
Bought by
Maltos Jose L
Purchase Details
Closed on
Jun 10, 1988
Bought by
Maltos Jose L
Create a Home Valuation Report for This Property
The Home Valuation Report is an in-depth analysis detailing your home's value as well as a comparison with similar homes in the area
Home Values in the Area
Average Home Value in this Area
Purchase History
| Date | Buyer | Sale Price | Title Company |
|---|---|---|---|
| Maltos Jose L | -- | None Available | |
| The Cosner Financial Group Lp | -- | None Available | |
| Maltos Jose L | -- | -- | |
| Maltos Jose L | -- | -- | |
| Maltos Jose L | -- | -- | |
| Maltos Jose L | -- | -- |
Source: Public Records
Mortgage History
| Date | Status | Borrower | Loan Amount |
|---|---|---|---|
| Closed | Maltos Jose L | $180,000 | |
| Previous Owner | The Cosner Financial Group Lp | $140,000 |
Source: Public Records
Tax History Compared to Growth
Tax History
| Year | Tax Paid | Tax Assessment Tax Assessment Total Assessment is a certain percentage of the fair market value that is determined by local assessors to be the total taxable value of land and additions on the property. | Land | Improvement |
|---|---|---|---|---|
| 2025 | $5,578 | $448,950 | $23,400 | $425,550 |
| 2024 | $5,587 | $452,990 | $23,400 | $429,590 |
| 2023 | $5,098 | $424,540 | $23,400 | $401,140 |
| 2022 | $6,078 | $389,020 | $23,400 | $365,620 |
| 2021 | $6,476 | $371,730 | $23,400 | $348,330 |
| 2020 | $5,427 | $355,270 | $23,400 | $331,870 |
| 2019 | $6,726 | $355,270 | $23,400 | $331,870 |
| 2018 | $6,493 | $333,950 | $23,400 | $310,550 |
| 2017 | $6,299 | $323,950 | $23,400 | $300,550 |
| 2016 | $5,795 | $297,510 | $23,400 | $274,110 |
| 2015 | -- | $295,260 | $23,400 | $271,860 |
| 2014 | -- | $283,310 | $23,400 | $259,910 |
Source: Public Records
Map
Nearby Homes
- 4315 Lehigh Dr
- 4304 Downing Ave
- 4003 Compton Dr
- 4512 Norwood St
- 4209 Merrill Dr
- 4207 Merrill Dr
- 4502 Parkhurst Dr
- 3907 Westminister Dr
- 3804 Faircircle
- 4000 W Loop 250 N
- 4101 Gleneagles Dr
- 4505 Westminister Dr
- 4500 Westminister Dr
- 4307 Crestgate Ave
- 4002 Crestwood Ave
- 4200 Boulder Dr
- 4303 Arroyo Dr
- 4521 Gleneagles Dr
- 4700 Boulder Dr Unit 710
- 4700 Boulder Dr Unit 611
- 4305 Lehigh Dr
- 4105 Stratton Dr
- 4207 Lehigh Dr
- 4307 Lehigh Dr
- 4300 Lehigh Dr
- 4106 Stratton Dr
- 4304 Lehigh Dr
- 4212 Lehigh Dr
- 4104 Stratton Dr
- 4103 Stratton Dr
- 4306 Lehigh Dr
- 4205 Lehigh Dr
- 4210 Lehigh Dr
- 4309 Lehigh Dr
- 4310 Lehigh Dr
- 4102 Stratton Dr
- 4101 Stratton Dr
- 4206 Lehigh Dr
- 4013 Dunkirk St
- 4201 Lehigh Dr