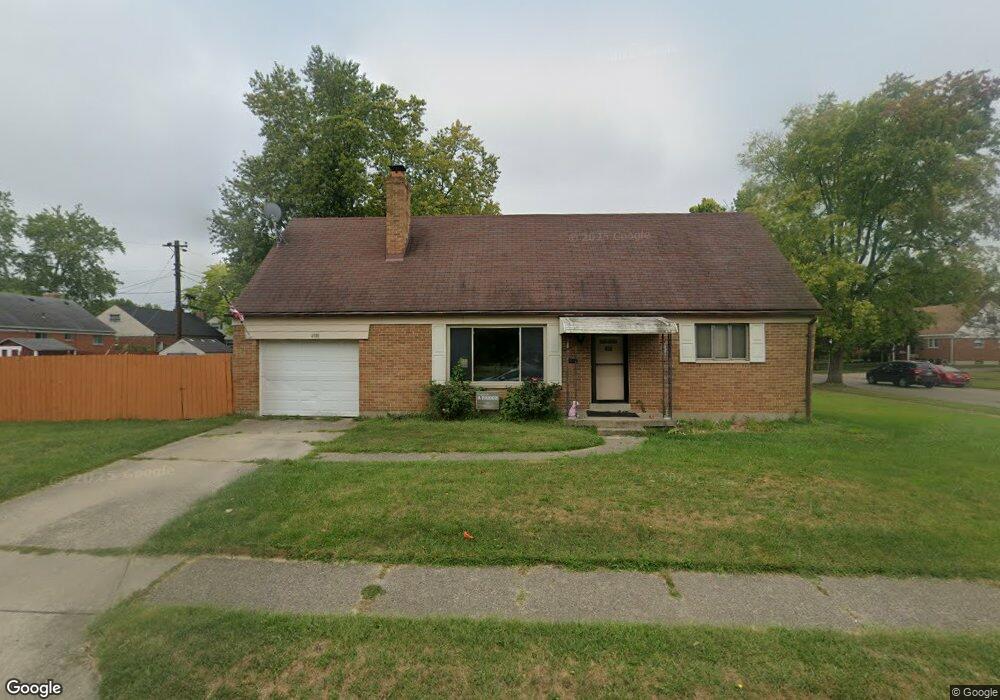
4301 Marshall Rd Dayton, OH 45429
Estimated Value: $229,000 - $286,000
4
Beds
2
Baths
1,415
Sq Ft
$184/Sq Ft
Est. Value
About This Home
This home is located at 4301 Marshall Rd, Dayton, OH 45429 and is currently estimated at $259,659, approximately $183 per square foot. 4301 Marshall Rd is a home located in Montgomery County with nearby schools including Oakview Elementary School, Van Buren Middle School, and Kettering Fairmont High School.
Ownership History
Date
Name
Owned For
Owner Type
Purchase Details
Closed on
Oct 18, 2010
Sold by
Theibert Properties Llc
Bought by
Theibert Matthew J and Theibert Jennifer D
Current Estimated Value
Purchase Details
Closed on
Aug 31, 2007
Sold by
Theibert Matthew J and Theibert Jennifer D
Bought by
Theibert Properties Llc
Home Financials for this Owner
Home Financials are based on the most recent Mortgage that was taken out on this home.
Original Mortgage
$92,700
Interest Rate
6.71%
Mortgage Type
Purchase Money Mortgage
Purchase Details
Closed on
Jul 25, 2007
Sold by
Tickel Delbert J
Bought by
Theibert Matthew J and Theibert Jennifer D
Home Financials for this Owner
Home Financials are based on the most recent Mortgage that was taken out on this home.
Original Mortgage
$92,700
Interest Rate
6.71%
Mortgage Type
Purchase Money Mortgage
Create a Home Valuation Report for This Property
The Home Valuation Report is an in-depth analysis detailing your home's value as well as a comparison with similar homes in the area
Home Values in the Area
Average Home Value in this Area
Purchase History
| Date | Buyer | Sale Price | Title Company |
|---|---|---|---|
| Theibert Matthew J | -- | Attorney | |
| Theibert Properties Llc | -- | Attorney | |
| Theibert Matthew J | $103,000 | Attorney |
Source: Public Records
Mortgage History
| Date | Status | Borrower | Loan Amount |
|---|---|---|---|
| Previous Owner | Theibert Matthew J | $92,700 |
Source: Public Records
Tax History Compared to Growth
Tax History
| Year | Tax Paid | Tax Assessment Tax Assessment Total Assessment is a certain percentage of the fair market value that is determined by local assessors to be the total taxable value of land and additions on the property. | Land | Improvement |
|---|---|---|---|---|
| 2024 | $4,847 | $75,970 | $14,160 | $61,810 |
| 2023 | $4,847 | $75,970 | $14,160 | $61,810 |
| 2022 | $4,622 | $57,260 | $10,650 | $46,610 |
| 2021 | $4,284 | $57,260 | $10,650 | $46,610 |
| 2020 | $4,297 | $57,260 | $10,650 | $46,610 |
| 2019 | $3,735 | $43,920 | $9,690 | $34,230 |
| 2018 | $3,755 | $43,920 | $9,690 | $34,230 |
| 2017 | $3,470 | $43,920 | $9,690 | $34,230 |
| 2016 | $3,213 | $39,110 | $9,690 | $29,420 |
| 2015 | $3,071 | $39,110 | $9,690 | $29,420 |
| 2014 | $3,071 | $39,110 | $9,690 | $29,420 |
| 2012 | -- | $39,580 | $9,680 | $29,900 |
Source: Public Records
Map
Nearby Homes
- 1328 Willowdale Ave
- 4244 Flowerdale Ave
- 4307 Meadowcroft Rd
- 1033 Carlo Dr
- 1013 Swango Dr
- 1105 Greenridge Dr
- 1008 Rio Ln
- 4640 Marshall Rd
- 3872 Maryknoll Dr
- 1310 Partridge Run Cir Unit 1310
- 959 Kimberly Dr
- 3725 Claybourne Rd
- 804 Lovetta Dr
- 791 Willowdale Ave
- 1049 Georgian Dr
- 3736 Valleywood Dr
- 3822 Milford Dr
- 2021 Stayman Dr
- 855 Brookfield Rd
- 4541 Acreview Ln
- 1220 Larriwood Ave
- 4319 Marshall Rd
- 1216 Larriwood Ave
- 1209 Willowdale Ave
- 4300 Marshall Rd
- 1205 Willowdale Ave
- 4221 Marshall Rd
- 4304 Marshall Rd
- 1221 Larriwood Ave
- 1301 Rochelle Ave
- 1212 Larriwood Ave
- 4308 Marshall Rd
- 4224 Marshall Rd
- 1217 Larriwood Ave
- 1201 Willowdale Ave
- 4220 Marshall Rd
- 1208 Larriwood Ave
- 1213 Larriwood Ave
- 1304 Rochelle Ave
- 1309 Rochelle Ave