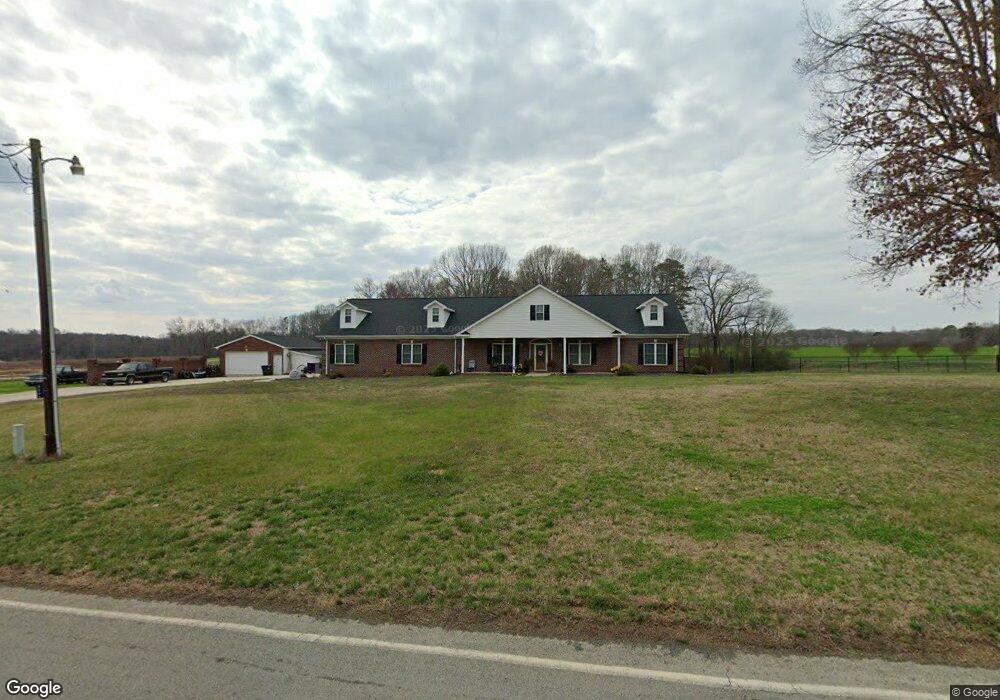
4301 Sincerity Rd Monroe, NC 28110
Estimated Value: $581,000 - $707,000
3
Beds
3
Baths
2,952
Sq Ft
$216/Sq Ft
Est. Value
About This Home
This home is located at 4301 Sincerity Rd, Monroe, NC 28110 and is currently estimated at $639,098, approximately $216 per square foot. 4301 Sincerity Rd is a home located in Union County with nearby schools including Unionville Elementary School, Piedmont Middle School, and Piedmont High School.
Ownership History
Date
Name
Owned For
Owner Type
Purchase Details
Closed on
Apr 23, 2015
Sold by
Pressley Marvin Scott and Pressley Elizabeth
Bought by
Webb Richard A and Webb Melissa N
Current Estimated Value
Home Financials for this Owner
Home Financials are based on the most recent Mortgage that was taken out on this home.
Original Mortgage
$299,250
Outstanding Balance
$230,800
Interest Rate
3.95%
Mortgage Type
New Conventional
Estimated Equity
$408,298
Purchase Details
Closed on
Dec 23, 2014
Sold by
Pressley Amy and Pressley Marvin Scott
Bought by
Greene Timothy James
Purchase Details
Closed on
Feb 28, 2014
Sold by
Greene Timothy James and Greene Cathy Dean Brady
Bought by
Pressley Marvin Scott and Pressley Amy Elizabeth
Purchase Details
Closed on
Oct 1, 2004
Sold by
Helms Amy Elizabeth
Bought by
Helms Amy Elizabeth and Pressley Marvin Scott
Purchase Details
Closed on
Sep 28, 2004
Sold by
Helms Carolyn B and Helms George L
Bought by
Helms Amy Elizabeth
Create a Home Valuation Report for This Property
The Home Valuation Report is an in-depth analysis detailing your home's value as well as a comparison with similar homes in the area
Purchase History
| Date | Buyer | Sale Price | Title Company |
|---|---|---|---|
| Webb Richard A | $315,000 | Chicago Title Insurance Co | |
| Greene Timothy James | $7,000 | Chicago Title Insurance Co | |
| Pressley Marvin Scott | -- | None Available | |
| Helms Amy Elizabeth | -- | -- | |
| Helms Amy Elizabeth | -- | -- |
Source: Public Records
Mortgage History
| Date | Status | Borrower | Loan Amount |
|---|---|---|---|
| Open | Webb Richard A | $299,250 |
Source: Public Records
Tax History
| Year | Tax Paid | Tax Assessment Tax Assessment Total Assessment is a certain percentage of the fair market value that is determined by local assessors to be the total taxable value of land and additions on the property. | Land | Improvement |
|---|---|---|---|---|
| 2025 | $2,758 | $564,900 | $0 | $0 |
| 2024 | $2,585 | $394,200 | $40,800 | $353,400 |
| 2023 | $2,560 | $394,200 | $40,800 | $353,400 |
| 2022 | $2,560 | $394,200 | $40,800 | $353,400 |
| 2021 | $2,561 | $394,200 | $40,800 | $353,400 |
| 2020 | $2,272 | $292,780 | $29,780 | $263,000 |
| 2019 | $2,240 | $292,780 | $29,780 | $263,000 |
| 2018 | $0 | $292,780 | $29,780 | $263,000 |
| 2017 | $2,387 | $292,800 | $29,800 | $263,000 |
| 2016 | $2,344 | $292,780 | $29,780 | $263,000 |
| 2015 | $2,374 | $292,780 | $29,780 | $263,000 |
| 2014 | $1,880 | $273,390 | $42,300 | $231,090 |
Source: Public Records
Map
Nearby Homes
- 5803 Morgan Mill Rd
- 5509 Morgan Mill Rd
- 3013 Isle Ln
- 2010 Parrothead Dr
- 3003 Buffett Ln
- 3030 Buffett Ln Unit 49
- 1912 New Salem Rd
- 1910 New Salem Rd
- 3211 Old Camden Rd
- 2907 New Salem Rd
- 3907 E Lawyers Rd
- 0 Sikes Mill Rd Unit CAR4186382
- 3028 Austin Chaney Rd
- 2820 Loxdale Farms Dr Unit 14
- 1400 Henry Smith Rd
- 0 Unionville Rd
- 2003 Duntov Dr
- 4048 Avis Way
- 4106 New Salem Rd
- 1307 N Hills Dr
- 4218 Sincerity Rd Unit 5
- 4208 Sincerity Rd
- 4212 Sincerity Rd Unit 2
- Lot #2 Sincerity Rd Unit Lot 2
- 4216 Sincerity Rd
- 4220 Sincerity Rd Unit 4
- 4309 Sincerity Rd
- 4306 Sincerity Rd
- 4312 Sincerity Rd
- 4203 Sincerity Rd
- 4310 Sincerity Rd
- 4308 Sincerity Rd
- 4316 Sincerity Rd
- 4111 Sincerity Rd
- 4110 Sincerity Rd
- 4104 Sincerity Rd
- 5906 Morgan Mill Rd
- 4103 Sincerity Rd
- 4103 Sincerity Rd
- 4413 Sincerity Rd
Your Personal Tour Guide
Ask me questions while you tour the home.