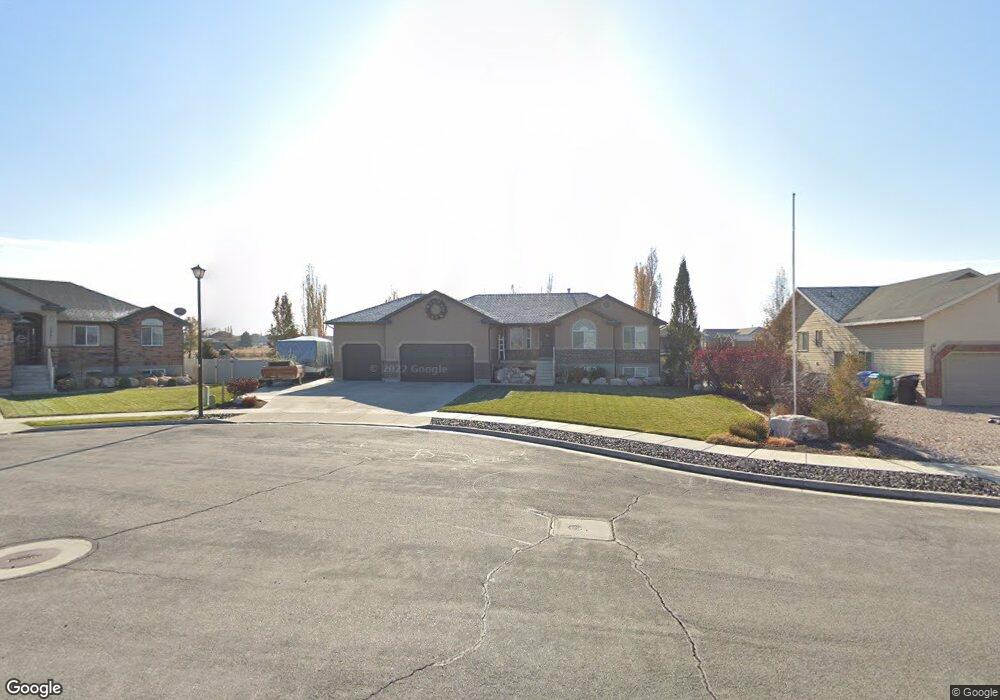
4301 W 1475 N West Point, UT 84015
Estimated Value: $579,000 - $699,000
5
Beds
3
Baths
3,031
Sq Ft
$214/Sq Ft
Est. Value
About This Home
This home is located at 4301 W 1475 N, West Point, UT 84015 and is currently estimated at $647,400, approximately $213 per square foot. 4301 W 1475 N is a home located in Davis County with nearby schools including West Point School, West Point Junior High School, and Syracuse High School.
Ownership History
Date
Name
Owned For
Owner Type
Purchase Details
Closed on
Jan 27, 2015
Sold by
Bingham Nicole
Bought by
Oram Rick and Oram Alisa
Current Estimated Value
Home Financials for this Owner
Home Financials are based on the most recent Mortgage that was taken out on this home.
Original Mortgage
$264,900
Outstanding Balance
$202,226
Interest Rate
3.75%
Mortgage Type
New Conventional
Estimated Equity
$445,174
Purchase Details
Closed on
May 1, 2009
Sold by
Barnes Banking Company
Bought by
Bingham Nicole
Home Financials for this Owner
Home Financials are based on the most recent Mortgage that was taken out on this home.
Original Mortgage
$233,007
Interest Rate
4.99%
Mortgage Type
FHA
Purchase Details
Closed on
Sep 19, 2008
Sold by
J M Tanner Co and Tanner Jon M
Bought by
Barnes Banking Co
Purchase Details
Closed on
Jun 29, 2007
Sold by
Dhi Builders Llc
Bought by
J M Tanner Co
Purchase Details
Closed on
Apr 27, 2006
Sold by
M & D Developers Llc
Bought by
Dhi Builders Llc
Create a Home Valuation Report for This Property
The Home Valuation Report is an in-depth analysis detailing your home's value as well as a comparison with similar homes in the area
Home Values in the Area
Average Home Value in this Area
Purchase History
| Date | Buyer | Sale Price | Title Company |
|---|---|---|---|
| Oram Rick | -- | First American Title | |
| Bingham Nicole | -- | Founders Title Co Layton | |
| Barnes Banking Co | -- | Inwest Title Services Inc | |
| J M Tanner Co | -- | Equity Title Ins Agency Inc | |
| Dhi Builders Llc | -- | Heritage West Title Ins Agen |
Source: Public Records
Mortgage History
| Date | Status | Borrower | Loan Amount |
|---|---|---|---|
| Open | Oram Rick | $264,900 | |
| Previous Owner | Bingham Nicole | $233,007 |
Source: Public Records
Tax History Compared to Growth
Tax History
| Year | Tax Paid | Tax Assessment Tax Assessment Total Assessment is a certain percentage of the fair market value that is determined by local assessors to be the total taxable value of land and additions on the property. | Land | Improvement |
|---|---|---|---|---|
| 2025 | $3,362 | $321,750 | $123,109 | $198,641 |
| 2024 | $3,362 | $310,750 | $110,780 | $199,970 |
| 2023 | $3,107 | $528,000 | $141,405 | $386,595 |
| 2022 | $3,369 | $313,500 | $74,497 | $239,003 |
| 2021 | $3,091 | $430,000 | $112,779 | $317,221 |
| 2020 | $2,730 | $374,000 | $95,396 | $278,604 |
| 2019 | $2,608 | $352,000 | $92,358 | $259,642 |
| 2018 | $2,423 | $322,000 | $90,937 | $231,063 |
| 2016 | $2,244 | $156,475 | $35,248 | $121,227 |
| 2015 | $2,289 | $151,250 | $35,248 | $116,002 |
| 2014 | $2,055 | $137,366 | $35,248 | $102,118 |
| 2013 | -- | $135,017 | $35,789 | $99,228 |
Source: Public Records
Map
Nearby Homes
- 4302 W 1550 N
- 1717 N 4325 W
- 1635 N 4625 W
- 4061 W 1250 N Unit 1250
- 1124 N 4150 W
- 4469 W 1000 N Unit 120
- 2084 N 4500 W
- 3932 W 825 N Unit WF5
- 3918 W 825 N Unit WF6
- 4171 W 2425 N
- 4719 W 650 N
- 3784 W 2300 N
- 3762 W 2300 N
- 477 N 4500 W
- 2118 Snowy Crane Dr
- Torino Farmhouse Plan at Cranefield Estates
- 1700 Farmhouse Plan at Cranefield Estates - Estates Collection
- 2000 Traditional Plan at Cranefield Estates - Estates Collection
- Murano Traditional Plan at Cranefield Estates - Estates Collection
- 2400 Farmhouse Plan at Cranefield Estates - Estates Collection