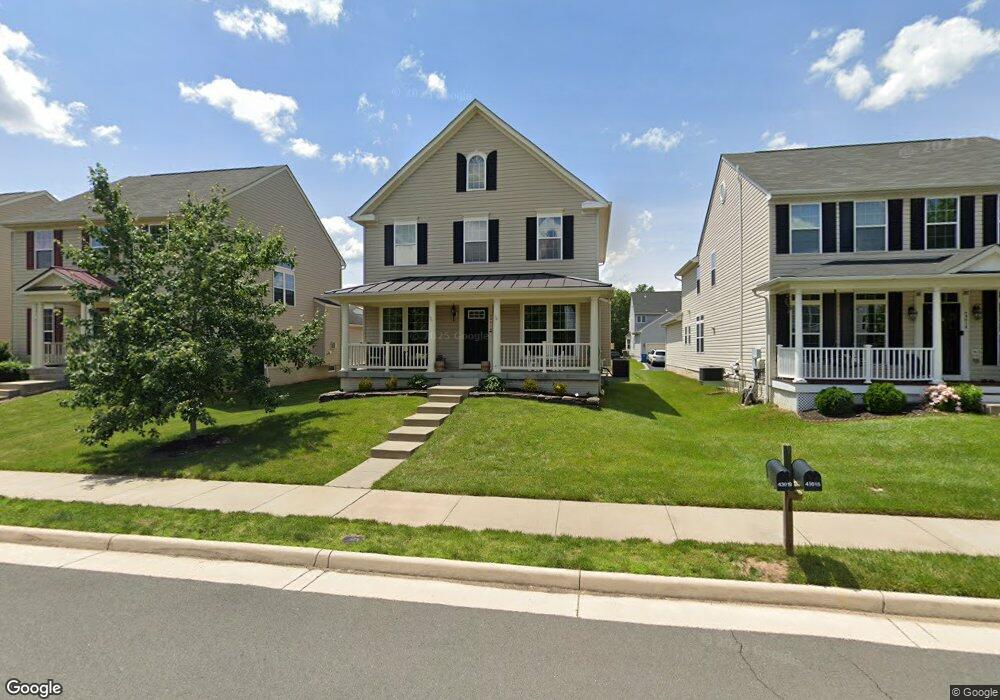
43019 Tippman Place South Riding, VA 20152
Estimated Value: $825,000 - $886,000
3
Beds
3
Baths
2,100
Sq Ft
$405/Sq Ft
Est. Value
About This Home
This home is located at 43019 Tippman Place, South Riding, VA 20152 and is currently estimated at $850,342, approximately $404 per square foot. 43019 Tippman Place is a home located in Loudoun County with nearby schools including Cardinal Ridge Elementary School, J. Michael Lunsford Middle School, and Freedom High School.
Ownership History
Date
Name
Owned For
Owner Type
Purchase Details
Closed on
Jun 7, 2018
Sold by
Penrod Jody D and Penrod Ronaele A
Bought by
Duhaiman Saleh and Alyahya Bedor
Current Estimated Value
Home Financials for this Owner
Home Financials are based on the most recent Mortgage that was taken out on this home.
Original Mortgage
$426,400
Outstanding Balance
$368,765
Interest Rate
4.5%
Mortgage Type
Purchase Money Mortgage
Estimated Equity
$481,577
Purchase Details
Closed on
May 27, 2011
Sold by
Nvr Inc
Bought by
Penrod Jody D
Home Financials for this Owner
Home Financials are based on the most recent Mortgage that was taken out on this home.
Original Mortgage
$436,300
Interest Rate
4.94%
Mortgage Type
VA
Purchase Details
Closed on
Feb 15, 2011
Sold by
Elk Run Properties Llc
Bought by
Nvr Inc
Create a Home Valuation Report for This Property
The Home Valuation Report is an in-depth analysis detailing your home's value as well as a comparison with similar homes in the area
Home Values in the Area
Average Home Value in this Area
Purchase History
| Date | Buyer | Sale Price | Title Company |
|---|---|---|---|
| Duhaiman Saleh | $533,000 | Rgs Title Llc | |
| Penrod Jody D | $430,490 | -- | |
| Nvr Inc | $165,000 | -- |
Source: Public Records
Mortgage History
| Date | Status | Borrower | Loan Amount |
|---|---|---|---|
| Open | Duhaiman Saleh | $426,400 | |
| Previous Owner | Penrod Jody D | $436,300 |
Source: Public Records
Tax History Compared to Growth
Tax History
| Year | Tax Paid | Tax Assessment Tax Assessment Total Assessment is a certain percentage of the fair market value that is determined by local assessors to be the total taxable value of land and additions on the property. | Land | Improvement |
|---|---|---|---|---|
| 2025 | $6,360 | $790,040 | $296,400 | $493,640 |
| 2024 | $6,512 | $752,800 | $271,400 | $481,400 |
| 2023 | $6,263 | $715,770 | $271,400 | $444,370 |
| 2022 | $6,215 | $698,280 | $241,400 | $456,880 |
| 2021 | $5,686 | $580,160 | $206,400 | $373,760 |
| 2020 | $5,463 | $527,790 | $196,400 | $331,390 |
| 2019 | $5,439 | $520,520 | $196,400 | $324,120 |
| 2018 | $5,299 | $488,430 | $176,400 | $312,030 |
| 2017 | $5,317 | $472,590 | $176,400 | $296,190 |
| 2016 | $5,344 | $466,740 | $0 | $0 |
| 2015 | $5,249 | $286,110 | $0 | $286,110 |
| 2014 | $5,074 | $262,870 | $0 | $262,870 |
Source: Public Records
Map
Nearby Homes
- 43023 Spyder Place
- 26089 Wendell St
- 25857 Kirkwood Square
- 0 Braddock Rd Unit VALO2086014
- 25670 S Village Dr
- 42835 Shaler St
- 43356 Hillpark St
- 26134 Lands End Dr
- 43441 Bettys Farm Dr
- 25442 Herring Creek Dr
- 43017 Beachall St
- 26005 Hartwood Dr
- 25390 Shipley Terrace
- 25466 Chambers Dr
- 42791 Flannigan Terrace
- 42768 Kearney Terrace
- 42799 Sykes Terrace
- 42790 Sykes Terrace
- 25304 Shipley Terrace
- 43362 Wayfarer Square
- 43019 Tippman Place
- 43023 Tippman Place
- 43015 Tippman Place
- 43027 Tippman Place
- 43031 Tippman Place
- 26030 First Frost Way
- 43022 Tippman Place
- 26026 First Frost Way
- 26034 First Frost Way
- 43018 Tippman Place
- 43014 Tippman Place
- 26038 First Frost Way
- 43026 Tippman Place
- 43035 Tippman Place
- 26066 Kimberly Rose Dr
- 26042 First Frost Way
- 43010 Tippman Place
- 43030 Tippman Place
- 26062 Kimberly Rose Dr
- 26058 Kimberly Rose Dr