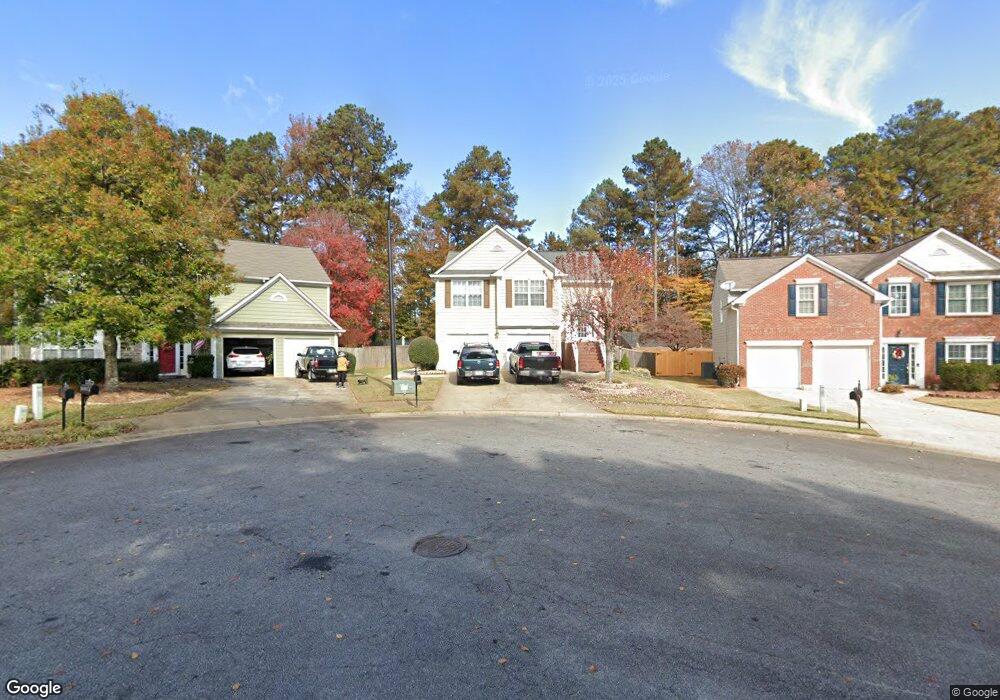
4302 Brighton Ct NW Unit 61 Kennesaw, GA 30144
Estimated Value: $380,000 - $428,000
4
Beds
3
Baths
2,253
Sq Ft
$178/Sq Ft
Est. Value
About This Home
This home is located at 4302 Brighton Ct NW Unit 61, Kennesaw, GA 30144 and is currently estimated at $401,061, approximately $178 per square foot. 4302 Brighton Ct NW Unit 61 is a home located in Cobb County with nearby schools including Kennesaw Elementary School, Big Shanty Elementary School, and Awtrey Middle School.
Ownership History
Date
Name
Owned For
Owner Type
Purchase Details
Closed on
Apr 21, 2014
Sold by
Parker Toya L
Bought by
Coria Jaidy M
Current Estimated Value
Home Financials for this Owner
Home Financials are based on the most recent Mortgage that was taken out on this home.
Original Mortgage
$153,900
Outstanding Balance
$116,783
Interest Rate
4.37%
Mortgage Type
New Conventional
Estimated Equity
$284,278
Purchase Details
Closed on
Dec 29, 2004
Sold by
Woodin Timothy A and Woodin Denise
Bought by
Parker Toya L
Home Financials for this Owner
Home Financials are based on the most recent Mortgage that was taken out on this home.
Original Mortgage
$173,250
Interest Rate
5.71%
Mortgage Type
VA
Purchase Details
Closed on
Nov 3, 1998
Sold by
Homeside Lending Inc
Bought by
Sec Of Hud
Purchase Details
Closed on
Oct 27, 1995
Sold by
Atlanta S G Torrey
Bought by
Coleman Fred O Portia
Create a Home Valuation Report for This Property
The Home Valuation Report is an in-depth analysis detailing your home's value as well as a comparison with similar homes in the area
Home Values in the Area
Average Home Value in this Area
Purchase History
| Date | Buyer | Sale Price | Title Company |
|---|---|---|---|
| Coria Jaidy M | $162,000 | -- | |
| Parker Toya L | $176,000 | -- | |
| Sec Of Hud | -- | -- | |
| Homeside Lending | $134,975 | -- | |
| Coleman Fred O Portia | $126,300 | -- |
Source: Public Records
Mortgage History
| Date | Status | Borrower | Loan Amount |
|---|---|---|---|
| Open | Coria Jaidy M | $153,900 | |
| Previous Owner | Parker Toya L | $173,250 | |
| Closed | Coleman Fred O Portia | $0 |
Source: Public Records
Tax History Compared to Growth
Tax History
| Year | Tax Paid | Tax Assessment Tax Assessment Total Assessment is a certain percentage of the fair market value that is determined by local assessors to be the total taxable value of land and additions on the property. | Land | Improvement |
|---|---|---|---|---|
| 2025 | $3,971 | $131,796 | $34,000 | $97,796 |
| 2024 | $3,974 | $131,796 | $34,000 | $97,796 |
| 2023 | $3,869 | $128,324 | $24,000 | $104,324 |
| 2022 | $3,895 | $128,324 | $24,000 | $104,324 |
| 2021 | $2,990 | $98,512 | $24,000 | $74,512 |
| 2020 | $3,822 | $95,920 | $24,000 | $71,920 |
| 2019 | $2,793 | $92,040 | $24,000 | $68,040 |
| 2018 | $2,788 | $91,864 | $24,000 | $67,864 |
| 2017 | $1,938 | $67,416 | $16,000 | $51,416 |
| 2016 | $1,938 | $67,416 | $16,000 | $51,416 |
| 2015 | $1,760 | $59,732 | $16,000 | $43,732 |
| 2014 | $1,775 | $59,732 | $0 | $0 |
Source: Public Records
Map
Nearby Homes
- 4851 Lake Park Ln
- 4424 High Gate Dr NW
- 3038 Fairhaven Ridge NW
- 4317 Chesapeake Trace NW
- 2617 Lake Park Bend
- 4348 Richmond Place NW Unit 1
- 4476 High Gate Ct NW
- 4179 Gramercy Main NW
- 4518 Columbus Cir
- 4157 Berkeley Landing NW
- 2698 Claredon Trace NW
- 4591 Grenadine Cir
- 4514 Lake Park Dr
- 4210 Steeplehill Dr NW
- 3324 Whitmore Ct
- 4336 Thorngate Ln
- 2740 Lake Park Ridge W
- 4561 Grenadine Cir
- 2773 Northgate Way NW Unit 1
- 4302 Brighton Ct NW
- 4300 Brighton Ct NW
- 4304 Brighton Ct NW
- 4267 Brighton Way NW
- 4305 Brighton Ct NW
- 4303 Brighton Ct NW
- 4269 Brighton Way NW
- 4360 Sentinel Place NW
- 4268 Brighton Way NW
- 4358 Sentinel Place NW
- 4256 Brighton Way NW
- 4253 Brighton Way NW
- 4362 Sentinel Place NW
- 2986 Downing Ln NW
- 4270 Brighton Way NW
- 4254 Brighton Way NW
- 4273 Brighton Way NW
- 2984 Downing Ln NW
- 2982 Downing Ln NW
- 4251 Brighton Way NW