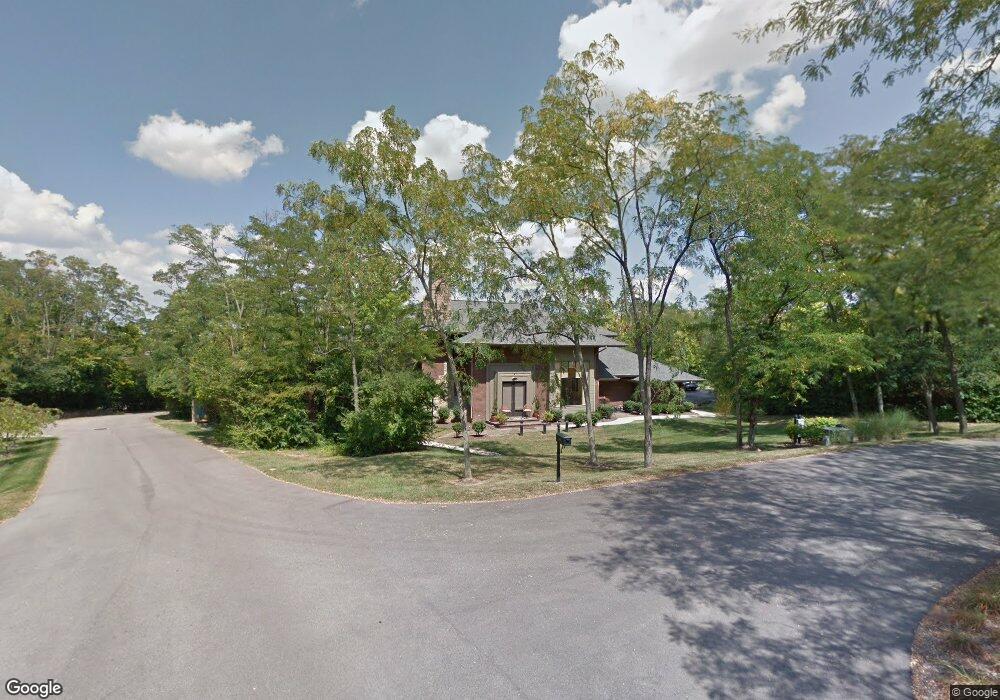
4302 European Jaunt West Chester, OH 45069
West Chester Township NeighborhoodEstimated Value: $614,000 - $702,000
3
Beds
4
Baths
2,857
Sq Ft
$234/Sq Ft
Est. Value
About This Home
This home is located at 4302 European Jaunt, West Chester, OH 45069 and is currently estimated at $667,585, approximately $233 per square foot. 4302 European Jaunt is a home located in Butler County with nearby schools including Endeavor Elementary School, Lakota Plains Junior School, and Lakota West High School.
Ownership History
Date
Name
Owned For
Owner Type
Purchase Details
Closed on
Sep 6, 2022
Sold by
Yeazell Michael R
Bought by
Faulk Vondetta
Current Estimated Value
Purchase Details
Closed on
May 11, 2010
Sold by
Creative Capital Llc
Bought by
Yeazell Michael R
Purchase Details
Closed on
Nov 30, 2009
Sold by
First Preferred Mortgage Company
Bought by
Creative Capital Llc
Purchase Details
Closed on
May 31, 2007
Sold by
The Park National Bank
Bought by
Fpmc Realty Llc
Purchase Details
Closed on
Mar 21, 2007
Sold by
Richard A Morris Concepts Llc
Bought by
The Park National Bank
Purchase Details
Closed on
Oct 26, 2004
Sold by
Morris Richard and Morris Richard A
Bought by
Richard A Morris Concepts Llc
Home Financials for this Owner
Home Financials are based on the most recent Mortgage that was taken out on this home.
Original Mortgage
$600,000
Interest Rate
5.81%
Mortgage Type
Construction
Create a Home Valuation Report for This Property
The Home Valuation Report is an in-depth analysis detailing your home's value as well as a comparison with similar homes in the area
Home Values in the Area
Average Home Value in this Area
Purchase History
| Date | Buyer | Sale Price | Title Company |
|---|---|---|---|
| Faulk Vondetta | -- | -- | |
| Yeazell Michael R | $325,000 | Attorney | |
| Creative Capital Llc | $600,000 | Attorney | |
| Fpmc Realty Llc | $310,000 | None Available | |
| The Park National Bank | $299,000 | None Available | |
| Richard A Morris Concepts Llc | $135,000 | -- |
Source: Public Records
Mortgage History
| Date | Status | Borrower | Loan Amount |
|---|---|---|---|
| Previous Owner | Richard A Morris Concepts Llc | $600,000 |
Source: Public Records
Tax History Compared to Growth
Tax History
| Year | Tax Paid | Tax Assessment Tax Assessment Total Assessment is a certain percentage of the fair market value that is determined by local assessors to be the total taxable value of land and additions on the property. | Land | Improvement |
|---|---|---|---|---|
| 2024 | $8,560 | $207,590 | $17,500 | $190,090 |
| 2023 | $8,499 | $209,280 | $17,500 | $191,780 |
| 2022 | $8,385 | $146,100 | $17,500 | $128,600 |
| 2021 | $7,554 | $139,970 | $17,500 | $122,470 |
| 2020 | $7,734 | $139,970 | $17,500 | $122,470 |
| 2019 | $12,892 | $134,530 | $17,500 | $117,030 |
| 2018 | $7,807 | $134,530 | $17,500 | $117,030 |
| 2017 | $7,947 | $134,530 | $17,500 | $117,030 |
| 2016 | $8,044 | $128,240 | $17,500 | $110,740 |
| 2015 | $8,043 | $128,240 | $17,500 | $110,740 |
| 2014 | $9,065 | $128,240 | $17,500 | $110,740 |
| 2013 | $9,065 | $140,700 | $35,000 | $105,700 |
Source: Public Records
Map
Nearby Homes
- 4224 College Dictionary
- 4257 Primary Colors
- 4401 E Observatory
- 7066 Hearthside Ct
- 4101 Jamie Dr
- 4210 Tylers Estates Dr
- 4387 Tylers Estates Dr
- 7611 Tylers Hill Ct
- 4625 Guildford Dr
- 7075 Ashwood Knolls Dr
- 6674 Southampton Ln
- 3946 Hamilton Mason Rd
- 6875 Crown Pointe Dr
- 7257 Clawson Ct
- 4377 Stone Creek Dr
- 7350 Keltner Dr
- 6940 Crown Pointe Dr
- 7238 Canvas Canopy Unit 91
- 42 Illumination
- 42 Illumination Unit 42
- 7248 Canvas Canopy
- 7258 Canvas Canopy
- 4300 Illumination
- 4274 College Dictionary
- 4274 College Dictionary Unit 67
- 4284 College Dictionary
- 4324 College Dictionary
- 4264 College Dictionary Unit 68
- 4264 College Dictionary Unit Lot 3
- 4264 College Dictionary Unit 3
- 4264 College Dictionary
- 4254 College Dictionary
- 4254 College Dictionary Unit 87
- 4271 Hamilton Mason Rd
- 4363 European Jaunt
- 8 College Dictionary
- 91 Canvas Canopy