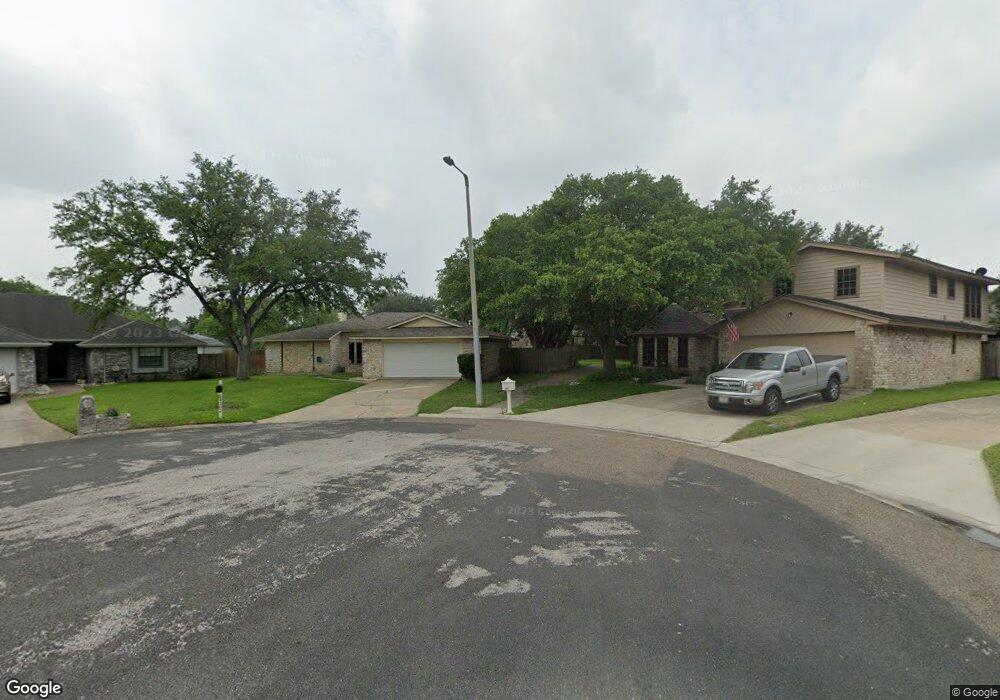
4302 Pecan Bayou Ct Unit 2 Corpus Christi, TX 78410
Calallen NeighborhoodEstimated Value: $266,000 - $294,000
3
Beds
2
Baths
1,937
Sq Ft
$142/Sq Ft
Est. Value
About This Home
This home is located at 4302 Pecan Bayou Ct Unit 2, Corpus Christi, TX 78410 and is currently estimated at $275,589, approximately $142 per square foot. 4302 Pecan Bayou Ct Unit 2 is a home located in Nueces County with nearby schools including Calallen West Intermediate School, Calallen Middle School, and Calallen High School.
Ownership History
Date
Name
Owned For
Owner Type
Purchase Details
Closed on
Apr 4, 2019
Sold by
First Capital Properties Ltd
Bought by
Goodman Nicholas J
Current Estimated Value
Home Financials for this Owner
Home Financials are based on the most recent Mortgage that was taken out on this home.
Original Mortgage
$139,200
Outstanding Balance
$122,382
Interest Rate
4.3%
Mortgage Type
New Conventional
Estimated Equity
$153,207
Purchase Details
Closed on
Aug 31, 2018
Sold by
Benavides Alex R and Benavides Sylvia R
Bought by
First Capital Properties Ltd
Purchase Details
Closed on
Aug 3, 2010
Sold by
First Capital Properties Ltd
Bought by
Benavides Alex R and Benavides Sylvia R
Home Financials for this Owner
Home Financials are based on the most recent Mortgage that was taken out on this home.
Original Mortgage
$129,800
Interest Rate
4.08%
Mortgage Type
Seller Take Back
Create a Home Valuation Report for This Property
The Home Valuation Report is an in-depth analysis detailing your home's value as well as a comparison with similar homes in the area
Home Values in the Area
Average Home Value in this Area
Purchase History
| Date | Buyer | Sale Price | Title Company |
|---|---|---|---|
| Goodman Nicholas J | -- | Stewart Title Company | |
| First Capital Properties Ltd | -- | None Available | |
| Benavides Alex R | -- | None Available |
Source: Public Records
Mortgage History
| Date | Status | Borrower | Loan Amount |
|---|---|---|---|
| Open | Goodman Nicholas J | $139,200 | |
| Previous Owner | Benavides Alex R | $129,800 |
Source: Public Records
Tax History Compared to Growth
Tax History
| Year | Tax Paid | Tax Assessment Tax Assessment Total Assessment is a certain percentage of the fair market value that is determined by local assessors to be the total taxable value of land and additions on the property. | Land | Improvement |
|---|---|---|---|---|
| 2025 | $3,622 | $235,925 | $31,340 | $204,585 |
| 2024 | $5,135 | $217,884 | $0 | $0 |
| 2023 | $3,201 | $198,076 | $0 | $0 |
| 2022 | $4,938 | $192,690 | $0 | $0 |
| 2021 | $4,717 | $175,173 | $31,340 | $143,833 |
| 2020 | $4,806 | $174,000 | $31,340 | $142,660 |
| 2019 | $5,453 | $191,890 | $31,340 | $160,550 |
| 2018 | $4,927 | $192,387 | $31,340 | $161,047 |
| 2017 | $4,467 | $177,897 | $31,340 | $146,557 |
| 2016 | $4,061 | $174,025 | $31,340 | $142,685 |
| 2015 | $2,932 | $174,305 | $31,340 | $142,965 |
| 2014 | $2,932 | $168,768 | $31,340 | $137,428 |
Source: Public Records
Map
Nearby Homes
- 4318 Pecan Bayou Ct
- 4433 Clear Fork Dr
- 4457 River Park Dr
- 15249 Pecos River Dr
- 4425 River Park Dr
- 4305 Lavaca River Ct
- 14929 Red River Dr
- 15421 Ballad Tree Dr
- 4330 Wordsworth Creek Dr
- 14742 Keegan
- 4125 Rapids Dr
- 14924 Sandy Creek Ct
- 4502 Thoreau Cir
- 15306 Guadalupe River Dr
- 4042 River Walk Dr
- 4506 Thoreau Cir
- 14709 Attoyac Dr
- 15326 Chianti Ln
- 4249 Clear Fork Dr
- 15002 Santa Gertrudis Dr
- 4302 Pecan Bayou Ct
- 4301 Pecan Bayou Ct
- 4235 Petronila Creek Ct
- 4310 Pecan Bayou Ct
- 4305 Pecan Bayou Ct
- 4314 Pecan Bayou Ct
- 4309 Pecan Bayou Ct
- 4230 Petronila Creek Ct
- 4313 Pecan Bayou Ct
- 4233 Petronila Creek Ct
- 4305 Clear Fork Ct
- 4318 Wood River Dr
- 4301 Clear Fork Ct
- 4229 Cowhouse Creek Ct
- 4309 Clear Fork Ct
- 4322 Wood River Dr
- 4226 Petronila Creek Ct
- 4229 Petronila Creek Ct
- 4326 Wood River Dr