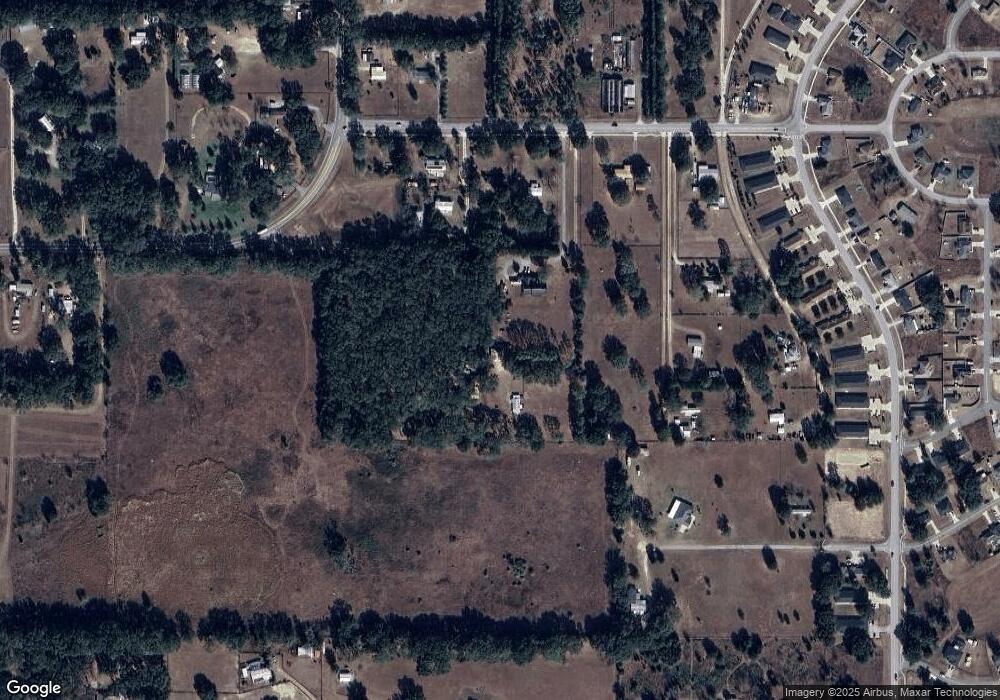
4302 SE 79th St Ocala, FL 34480
Silver Spring Shores NeighborhoodEstimated Value: $253,000 - $534,552
3
Beds
2
Baths
1,200
Sq Ft
$321/Sq Ft
Est. Value
About This Home
This home is located at 4302 SE 79th St, Ocala, FL 34480 and is currently estimated at $384,888, approximately $320 per square foot. 4302 SE 79th St is a home located in Marion County with nearby schools including Challenge School, Legacy Elementary School, and Indian River Virtual Instruction Program.
Ownership History
Date
Name
Owned For
Owner Type
Purchase Details
Closed on
Jan 25, 2023
Sold by
James Michael E and James Beverly J
Bought by
James Michael E and James Beverly J
Current Estimated Value
Purchase Details
Closed on
Jun 6, 2002
Sold by
Koontz Michael P and Mcclellan Sharon Koontz
Bought by
James Michael E
Purchase Details
Closed on
Jul 23, 2001
Sold by
Khan Twahir H
Bought by
James Michael E
Purchase Details
Closed on
Mar 9, 2001
Sold by
Khan Twahir H and Khan Mahmood H
Bought by
Khan Twahir H
Create a Home Valuation Report for This Property
The Home Valuation Report is an in-depth analysis detailing your home's value as well as a comparison with similar homes in the area
Home Values in the Area
Average Home Value in this Area
Purchase History
| Date | Buyer | Sale Price | Title Company |
|---|---|---|---|
| James Michael E | $100 | -- | |
| James Michael E | $60,000 | Advance Homestead Title | |
| James Michael E | $50,000 | Associated Land Title Insura | |
| Khan Twahir H | -- | -- |
Source: Public Records
Tax History Compared to Growth
Tax History
| Year | Tax Paid | Tax Assessment Tax Assessment Total Assessment is a certain percentage of the fair market value that is determined by local assessors to be the total taxable value of land and additions on the property. | Land | Improvement |
|---|---|---|---|---|
| 2025 | $4,694 | $310,160 | -- | -- |
| 2024 | $4,408 | $301,419 | -- | -- |
| 2023 | $3,726 | $256,352 | $0 | $0 |
| 2022 | $3,632 | $248,885 | $0 | $0 |
| 2021 | $3,553 | $236,804 | $0 | $0 |
| 2020 | $3,525 | $233,535 | $0 | $0 |
| 2019 | $3,389 | $223,183 | $0 | $0 |
| 2018 | $3,203 | $219,022 | $0 | $0 |
| 2017 | $3,144 | $214,517 | $0 | $0 |
| 2016 | $3,097 | $210,105 | $0 | $0 |
| 2015 | $3,118 | $208,644 | $0 | $0 |
| 2014 | $2,986 | $210,352 | $0 | $0 |
Source: Public Records
Map
Nearby Homes
- 7777 SE 41st Ct
- 156 Juniper Cir
- 14 Juniper Drive Ct
- 23 Juniper Loop Ct
- 25 Juniper Loop Ct
- 31 Juniper Dr
- 24 Juniper Dr
- 31 Juniper Loop Terrace
- 241 Chestnut Rd
- 128 Juniper Run
- 4 Juniper Trail Pass
- 159 Juniper Loop
- 112 Larch Rd
- 58 Juniper Trail Pass
- 66 Juniper Trail Pass
- 70 Juniper Trail Pass
- 68 Juniper Trail Pass
- 60 Juniper Trail Pass
- 0 Chestnut Rd Unit MFROM712846
- 228 Juniper Loop Cir
- 4300 SE 79th St
- 4242 SE 79th St
- 4206 SE 79th St
- 4370 SE 79th St
- 4380 SE 79th St
- 8200 Juniper Rd
- 4259 SE 79th St
- 4400 SE 79th St
- 8113 Juniper Rd
- 8106 Juniper Rd Unit 2
- 8106 Juniper Rd Unit 3
- 8106 Juniper Rd Unit All
- 8112 Juniper Rd
- 8112 Juniper Rd Unit 2
- 8112 Juniper Rd Unit 3
- 7885 SE 41st Ct
- 8100 Juniper Rd Unit 1
- 8100 Juniper Rd
- 8100 Juniper Rd Unit 4
- 8100 Juniper Rd Unit 2
