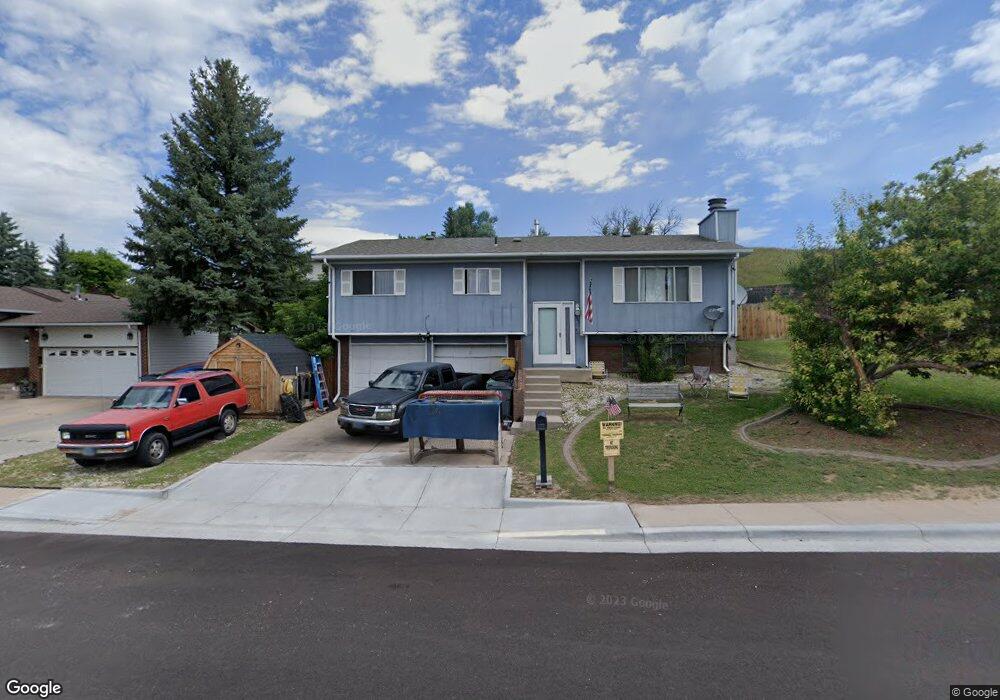
4302 Sullivan St Cheyenne, WY 82009
Estimated Value: $358,843 - $410,000
3
Beds
2
Baths
1,138
Sq Ft
$332/Sq Ft
Est. Value
About This Home
This home is located at 4302 Sullivan St, Cheyenne, WY 82009 and is currently estimated at $377,461, approximately $331 per square foot. 4302 Sullivan St is a home located in Laramie County with nearby schools including Dildine Elementary School, Carey Junior High School, and East High School.
Ownership History
Date
Name
Owned For
Owner Type
Purchase Details
Closed on
Dec 6, 2019
Sold by
Eje Wyoming Llc
Bought by
Crowningshield Christopher W
Current Estimated Value
Home Financials for this Owner
Home Financials are based on the most recent Mortgage that was taken out on this home.
Original Mortgage
$235,000
Outstanding Balance
$207,792
Interest Rate
3.75%
Mortgage Type
VA
Estimated Equity
$169,669
Purchase Details
Closed on
May 24, 2005
Sold by
Larson Richard R
Bought by
Mercier Properties Llc
Purchase Details
Closed on
Feb 20, 2004
Sold by
Frank Pamela A
Bought by
Larson Richard R
Home Financials for this Owner
Home Financials are based on the most recent Mortgage that was taken out on this home.
Original Mortgage
$101,600
Interest Rate
5.86%
Mortgage Type
Purchase Money Mortgage
Create a Home Valuation Report for This Property
The Home Valuation Report is an in-depth analysis detailing your home's value as well as a comparison with similar homes in the area
Purchase History
| Date | Buyer | Sale Price | Title Company |
|---|---|---|---|
| Crowningshield Christopher W | -- | First American | |
| Mercier Properties Llc | -- | -- | |
| Larson Richard R | -- | -- |
Source: Public Records
Mortgage History
| Date | Status | Borrower | Loan Amount |
|---|---|---|---|
| Open | Crowningshield Christopher W | $235,000 | |
| Previous Owner | Larson Richard R | $101,600 |
Source: Public Records
Tax History
| Year | Tax Paid | Tax Assessment Tax Assessment Total Assessment is a certain percentage of the fair market value that is determined by local assessors to be the total taxable value of land and additions on the property. | Land | Improvement |
|---|---|---|---|---|
| 2025 | $1,908 | $23,255 | $3,332 | $19,923 |
| 2024 | $1,908 | $29,977 | $4,442 | $25,535 |
| 2023 | $1,892 | $29,763 | $4,442 | $25,321 |
| 2022 | $1,985 | $27,499 | $4,442 | $23,057 |
| 2021 | $1,770 | $24,473 | $4,442 | $20,031 |
| 2020 | $1,603 | $22,216 | $4,442 | $17,774 |
| 2019 | $1,507 | $20,877 | $4,442 | $16,435 |
| 2018 | $1,407 | $19,679 | $3,341 | $16,338 |
| 2017 | $1,350 | $18,706 | $3,341 | $15,365 |
| 2016 | $1,283 | $17,764 | $3,162 | $14,602 |
| 2015 | $1,200 | $16,614 | $3,162 | $13,452 |
| 2014 | $1,181 | $16,250 | $3,162 | $13,088 |
Source: Public Records
Map
Nearby Homes
- 4400 Everton Dr
- TBD Lot 38 Panorama Dr
- TBD Lot 44 Panorama Dr
- TBD Lot 34 Panorama Dr
- TBD Lot 40 Panorama Dr
- TBD Lot 35 Panorama Dr
- TBD Lot 36 Panorama Dr
- TBD Lot 37 Panorama Dr
- TBD Lot 39 Panorama Dr
- 5318 Braehill Rd
- 4109 Rogers Ave
- 4700 Shell Beach Ave
- 4934 Carla Dr
- 134 Rio Verde Cir
- Lots 1-8 Connie Dr
- 128 Big Sandy Cir
- 5237 Shadow Rock Dr
- 5123 Carla Dr
- 4704 Garnet Way
- 4608 Garnet Way
- 4404 Sullivan St
- 4300 Sullivan St
- 4305 Carla Dr
- 4303 Carla Dr
- 4408 Sullivan St
- 4208 Sullivan St
- 4303 Sullivan St
- 4301 Carla Dr
- 4403 Sullivan St
- 4414 Sullivan St
- 4207 Anderson Ct
- 4411 Sullivan St
- 4301 Anderson Ct
- 5103 Griffith Ave
- 5101 Griffith Ave
- 5105 Griffith Ave
- 4211 Anderson Ct
- 4302 Carla Dr
- 4420 Sullivan St
- 4417 Sullivan St
Your Personal Tour Guide
Ask me questions while you tour the home.