Estimated Value: $401,000 - $486,000
2
Beds
2
Baths
875
Sq Ft
$491/Sq Ft
Est. Value
About This Home
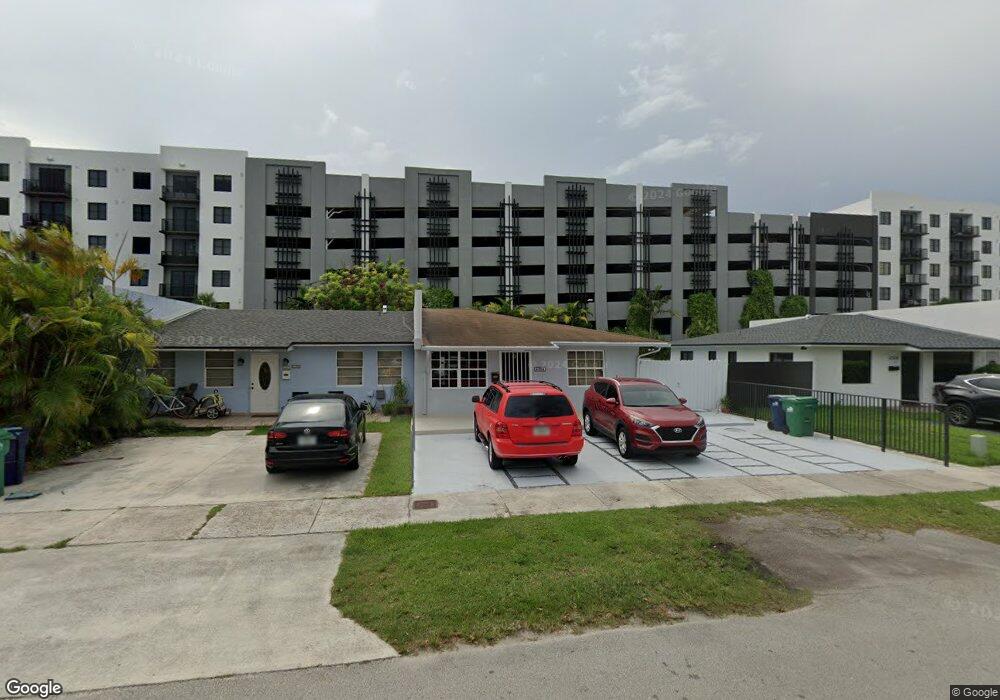
This home is located at 4302 SW 69th Ave, Miami, FL 33155 and is currently estimated at $429,872, approximately $491 per square foot. 4302 SW 69th Ave is a home located in Miami-Dade County with nearby schools including South Miami K-8 Center, South Miami Senior High School, and Palmetto Christian School.
Ownership History
Date
Name
Owned For
Owner Type
Purchase Details
Closed on
Nov 17, 2015
Sold by
Rodriguez Sergio
Bought by
Espinosa Olga L
Current Estimated Value
Purchase Details
Closed on
Jun 5, 2015
Sold by
Hernandez Obed and Hernandez Keila
Bought by
Rodriguez Sergio
Purchase Details
Closed on
Aug 27, 2004
Sold by
Valcarcel Rolando and Valcarcel Dalia O
Bought by
Hernandez Obed and Hernandez Keila
Home Financials for this Owner
Home Financials are based on the most recent Mortgage that was taken out on this home.
Original Mortgage
$170,000
Interest Rate
5.91%
Mortgage Type
Unknown
Purchase Details
Closed on
Jun 28, 1994
Sold by
Vidal Frank and Vidal Carmel
Bought by
Valcarcel Rolando and Valcarcel Dalia O
Home Financials for this Owner
Home Financials are based on the most recent Mortgage that was taken out on this home.
Original Mortgage
$70,000
Interest Rate
8.51%
Create a Home Valuation Report for This Property
The Home Valuation Report is an in-depth analysis detailing your home's value as well as a comparison with similar homes in the area
Home Values in the Area
Average Home Value in this Area
Purchase History
| Date | Buyer | Sale Price | Title Company |
|---|---|---|---|
| Espinosa Olga L | $250,000 | Attorney | |
| Rodriguez Sergio | $148,000 | C & C Title Agency Inc | |
| Hernandez Obed | $170,000 | -- | |
| Valcarcel Rolando | $80,000 | -- |
Source: Public Records
Mortgage History
| Date | Status | Borrower | Loan Amount |
|---|---|---|---|
| Previous Owner | Hernandez Obed | $170,000 | |
| Previous Owner | Valcarcel Rolando | $70,000 |
Source: Public Records
Tax History Compared to Growth
Tax History
| Year | Tax Paid | Tax Assessment Tax Assessment Total Assessment is a certain percentage of the fair market value that is determined by local assessors to be the total taxable value of land and additions on the property. | Land | Improvement |
|---|---|---|---|---|
| 2025 | $2,410 | $145,411 | -- | -- |
| 2024 | $2,202 | $141,313 | -- | -- |
| 2023 | $2,202 | $137,198 | $0 | $0 |
| 2022 | $2,092 | $133,202 | $0 | $0 |
| 2021 | $2,056 | $129,323 | $0 | $0 |
| 2020 | $2,031 | $127,538 | $0 | $0 |
| 2019 | $1,985 | $124,671 | $0 | $0 |
| 2018 | $1,881 | $122,347 | $0 | $0 |
| 2017 | $1,862 | $119,831 | $0 | $0 |
| 2016 | $1,827 | $117,367 | $0 | $0 |
| 2015 | $2,823 | $126,918 | $0 | $0 |
| 2014 | -- | $115,380 | $0 | $0 |
Source: Public Records
Map
Nearby Homes
- 4255 SW 69th Ave
- 6851 SW 44th St Unit 106
- 6851 SW 44th St Unit 210
- 6821 SW 44th St Unit 203
- 6801 SW 44th St Unit 101
- 4555 SW 68th Court Cir Unit 111
- 6825 SW 45th Ln Unit 12
- 4220 SW 71st Ave
- 6840 SW 45th Ln Unit 258
- 4300 SW 67th Ave Unit 23
- 4300 SW 67th Ave Unit 21
- 4250 SW 67th Ave Unit 32
- 4250 SW 67th Ave Unit 48
- 6780 SW 44th St Unit 8
- 4530 SW 68th Court Cir Unit 356
- 3955 SW 69th Ave
- 4600 SW 67th Ave Unit 237
- 4600 SW 67th Ave Unit 212
- 4600 SW 67th Ave Unit 125
- 4600 SW 67th Ave Unit 240
- 4302 SW 69th Ave
- 4300 SW 69th Ave
- 4300 SW 69th Ave
- 4304 SW 69th Ave Unit ______
- 4304 SW 69th Ave
- 4259 SW 69 Ave
- 4306 SW 69th Ave
- 4260 SW 69th Ave
- 4308 SW 69th Ave
- 4258 SW 69th Ave
- 4310 SW 69th Ave
- 4303 SW 69th Ave
- 4305 SW 69th Ave Unit 4305
- 4305 SW 69th Ave Unit 4309
- 4305 SW 69th Ave
- 4307 SW 69th Ave
- 4256 SW 69th Ave
- 4263 SW 69th Ave
- 4312 SW 69th Ave