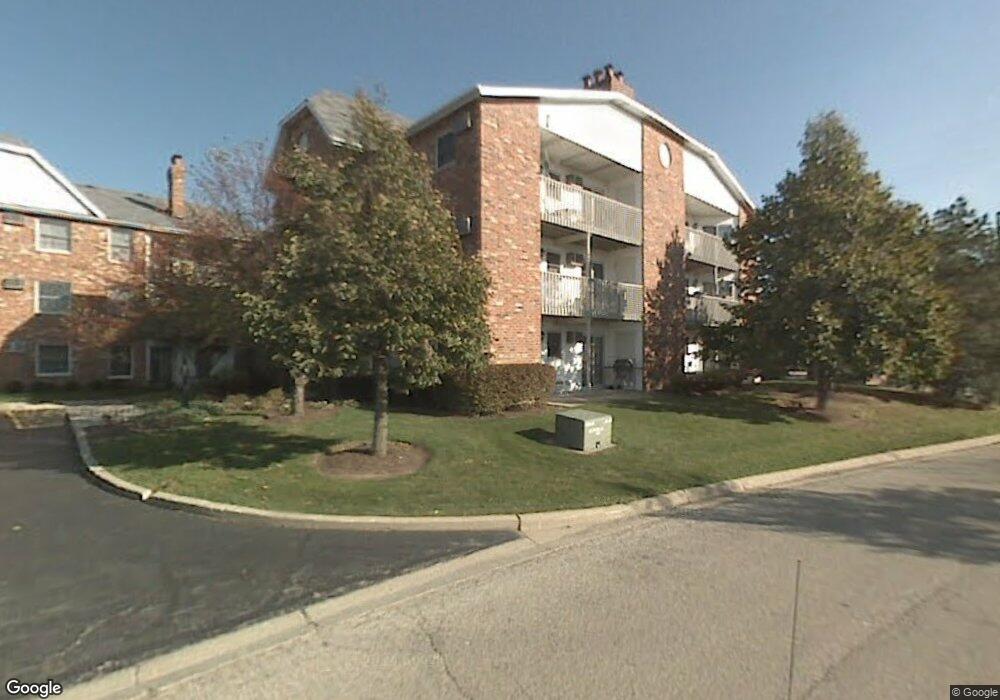
4302 W Shamrock Ln Unit 4302C McHenry, IL 60050
Estimated Value: $122,000 - $138,000
1
Bed
3
Baths
625
Sq Ft
$210/Sq Ft
Est. Value
About This Home
This home is located at 4302 W Shamrock Ln Unit 4302C, McHenry, IL 60050 and is currently estimated at $131,057, approximately $209 per square foot. 4302 W Shamrock Ln Unit 4302C is a home located in McHenry County with nearby schools including Riverwood Elementary School, Parkland School, and McHenry Community High School - Upper Campus.
Ownership History
Date
Name
Owned For
Owner Type
Purchase Details
Closed on
Oct 10, 2019
Sold by
Iiay Jeffrey A and Cash Leslie J
Bought by
Casey Sean M and Casey Katharine H
Current Estimated Value
Purchase Details
Closed on
Aug 4, 2006
Sold by
Cajthaml Shannon L and Cajthaml Albert
Bought by
Ray Jeffrey A and Cash Leslie J
Purchase Details
Closed on
Feb 25, 1999
Sold by
Laforest Jeanne
Bought by
Cajthaml Shannon L and Cajthaml Albert
Home Financials for this Owner
Home Financials are based on the most recent Mortgage that was taken out on this home.
Original Mortgage
$65,913
Interest Rate
6.92%
Mortgage Type
FHA
Purchase Details
Closed on
Oct 27, 1995
Sold by
Dannehy Shawn E
Bought by
Laforest Jeanne
Home Financials for this Owner
Home Financials are based on the most recent Mortgage that was taken out on this home.
Original Mortgage
$62,200
Interest Rate
7.3%
Mortgage Type
Purchase Money Mortgage
Create a Home Valuation Report for This Property
The Home Valuation Report is an in-depth analysis detailing your home's value as well as a comparison with similar homes in the area
Home Values in the Area
Average Home Value in this Area
Purchase History
| Date | Buyer | Sale Price | Title Company |
|---|---|---|---|
| Casey Sean M | $72,000 | Heritage Title Company | |
| Ray Jeffrey A | $90,000 | Ticor Title Ins Co 2002 | |
| Cajthaml Shannon L | $67,500 | Land Title Group | |
| Laforest Jeanne | $65,500 | -- |
Source: Public Records
Mortgage History
| Date | Status | Borrower | Loan Amount |
|---|---|---|---|
| Previous Owner | Cajthaml Shannon L | $65,913 | |
| Previous Owner | Laforest Jeanne | $62,200 |
Source: Public Records
Tax History Compared to Growth
Tax History
| Year | Tax Paid | Tax Assessment Tax Assessment Total Assessment is a certain percentage of the fair market value that is determined by local assessors to be the total taxable value of land and additions on the property. | Land | Improvement |
|---|---|---|---|---|
| 2024 | $2,403 | $28,554 | $2,483 | $26,071 |
| 2023 | $2,357 | $25,607 | $2,227 | $23,380 |
| 2022 | $2,151 | $22,696 | $1,974 | $20,722 |
| 2021 | $2,079 | $21,279 | $1,851 | $19,428 |
| 2020 | $2,066 | $20,642 | $1,796 | $18,846 |
| 2019 | $2,023 | $19,626 | $1,708 | $17,918 |
| 2018 | $1,648 | $14,403 | $1,383 | $13,020 |
| 2017 | $1,628 | $13,799 | $1,325 | $12,474 |
| 2016 | $1,611 | $13,166 | $1,264 | $11,902 |
| 2013 | -- | $19,073 | $1,203 | $17,870 |
Source: Public Records
Map
Nearby Homes
- 4302 W Shamrock Ln Unit 3C
- 4302 W Shamrock Ln Unit 2G
- 4314 W Shamrock Ln Unit 2D
- 4305 W Shamrock Ln Unit 3B
- Lot 48-53 Ridgeview Dr
- 702 S Il Route 31
- 626 Kresswood Dr Unit D
- 1100 S Illinois Route 31
- 1510 S Illinois Route 31
- 316 S Cross Trail
- 205 S Cross Trail Unit 4
- 3500 Biscayne Rd
- 1703 Cashel Ln
- 0000 Veterans Pkwy
- 5198 Bull Valley Rd
- 1622 Conway Cir
- 217 Barnwood Trail
- 2267 Concord Dr Unit 2267
- 4221 Savoy Ln Unit 28C721
- 1972 Concord Dr Unit 254
- 4302 W Shamrock Ln
- 4306 W Shamrock Ln Unit 43062B
- 4302 W Shamrock Ln
- 4302 W Shamrock Ln
- 4306 W Shamrock Ln
- 4302 W Shamrock Ln
- 4306 W Shamrock Ln
- 4308 W Shamrock Ln Unit 2A
- 4306 W Shamrock Ln
- 4302 W Shamrock Ln
- 4306 W Shamrock Ln Unit 1C
- 4308 W Shamrock Ln Unit 2C
- 4306 W Shamrock Ln Unit 2A
- 4306 W Shamrock Ln Unit 3B
- 4308 W Shamrock Ln Unit 1D
- 4308 W Shamrock Ln Unit 1C
- 4302 W Shamrock Ln Unit 3F
- 4302 W Shamrock Ln Unit 3A
- 4302 W Shamrock Ln
- 4302 W Shamrock Ln Unit 3G