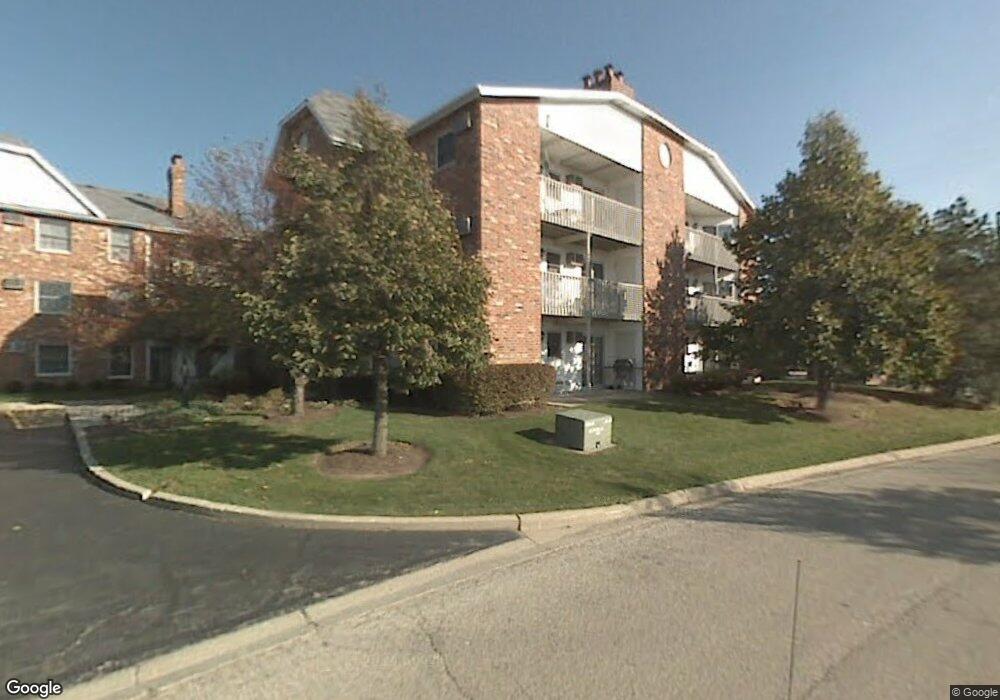
4302 W Shamrock Ln McHenry, IL 60050
Estimated Value: $137,000 - $145,000
1
Bed
3
Baths
725
Sq Ft
$195/Sq Ft
Est. Value
About This Home
This home is located at 4302 W Shamrock Ln, McHenry, IL 60050 and is currently estimated at $141,447, approximately $195 per square foot. 4302 W Shamrock Ln is a home located in McHenry County with nearby schools including Riverwood Elementary School, Parkland School, and McHenry Community High School - Upper Campus.
Ownership History
Date
Name
Owned For
Owner Type
Purchase Details
Closed on
Dec 2, 2019
Sold by
Schneider Stephen P
Bought by
Slaughter Jack G
Current Estimated Value
Purchase Details
Closed on
Oct 5, 2007
Sold by
Schneider Stephen P
Bought by
Schneider Stephen P and The Stephen P Schneider Living Trust
Purchase Details
Closed on
Mar 31, 2003
Sold by
Ryan William P
Bought by
Schneider Stephen P
Home Financials for this Owner
Home Financials are based on the most recent Mortgage that was taken out on this home.
Original Mortgage
$72,000
Interest Rate
6.5%
Mortgage Type
Purchase Money Mortgage
Purchase Details
Closed on
Oct 31, 1997
Sold by
Rechel David R
Bought by
Ryan William P
Home Financials for this Owner
Home Financials are based on the most recent Mortgage that was taken out on this home.
Original Mortgage
$58,400
Interest Rate
7.42%
Mortgage Type
Purchase Money Mortgage
Create a Home Valuation Report for This Property
The Home Valuation Report is an in-depth analysis detailing your home's value as well as a comparison with similar homes in the area
Home Values in the Area
Average Home Value in this Area
Purchase History
| Date | Buyer | Sale Price | Title Company |
|---|---|---|---|
| Slaughter Jack G | $80,000 | Fidelity National Title | |
| Schneider Stephen P | -- | None Available | |
| Schneider Stephen P | $90,000 | Universal Title Services Inc | |
| Ryan William P | $69,500 | -- |
Source: Public Records
Mortgage History
| Date | Status | Borrower | Loan Amount |
|---|---|---|---|
| Previous Owner | Schneider Stephen P | $72,000 | |
| Previous Owner | Ryan William P | $58,400 |
Source: Public Records
Tax History Compared to Growth
Tax History
| Year | Tax Paid | Tax Assessment Tax Assessment Total Assessment is a certain percentage of the fair market value that is determined by local assessors to be the total taxable value of land and additions on the property. | Land | Improvement |
|---|---|---|---|---|
| 2024 | $1,347 | $30,772 | $2,839 | $27,933 |
| 2023 | $1,245 | $27,596 | $2,546 | $25,050 |
| 2022 | $1,224 | $24,458 | $2,256 | $22,202 |
| 2021 | $1,146 | $22,931 | $2,115 | $20,816 |
| 2020 | $1,121 | $17,198 | $2,052 | $15,146 |
| 2019 | $2,180 | $21,149 | $1,951 | $19,198 |
| 2018 | $1,782 | $15,573 | $1,583 | $13,990 |
| 2017 | $1,760 | $14,920 | $1,517 | $13,403 |
| 2016 | $1,742 | $14,235 | $1,447 | $12,788 |
| 2013 | -- | $19,718 | $1,378 | $18,340 |
Source: Public Records
Map
Nearby Homes
- 4302 W Shamrock Ln Unit 2G
- 4304 W Shamrock Ln Unit 1A
- Lot 48-53 Ridgeview Dr
- 702 S Il Route 31
- 615 Kresswood Dr
- 220 S Glenbrook Trail
- 1100 S Illinois Route 31
- 1510 S Illinois Route 31
- 4240 Savoy Ln
- 0000 Veterans Pkwy
- 5198 Bull Valley Rd
- 2267 Concord Dr Unit 2267
- 3216 Biscayne Rd
- 2002 S Illinois Route 31
- 3732 Flynn St
- 3205 W Vista Terrace
- 304 Whitaker Trail Unit 24
- 613 S Broadway St
- 0 S Broadway St
- 5320 Cobblers Crossing Unit 173
- 4302 W Shamrock Ln
- 4306 W Shamrock Ln Unit 43062B
- 4302 W Shamrock Ln
- 4302 W Shamrock Ln
- 4306 W Shamrock Ln
- 4302 W Shamrock Ln
- 4306 W Shamrock Ln
- 4302 W Shamrock Ln Unit 4302C
- 4308 W Shamrock Ln Unit 2A
- 4306 W Shamrock Ln
- 4306 W Shamrock Ln Unit 1C
- 4308 W Shamrock Ln Unit 2C
- 4306 W Shamrock Ln Unit 2A
- 4306 W Shamrock Ln Unit 3B
- 4308 W Shamrock Ln Unit 1D
- 4308 W Shamrock Ln Unit 1C
- 4302 W Shamrock Ln Unit 3F
- 4302 W Shamrock Ln Unit 3A
- 4302 W Shamrock Ln
- 4302 W Shamrock Ln Unit 3G