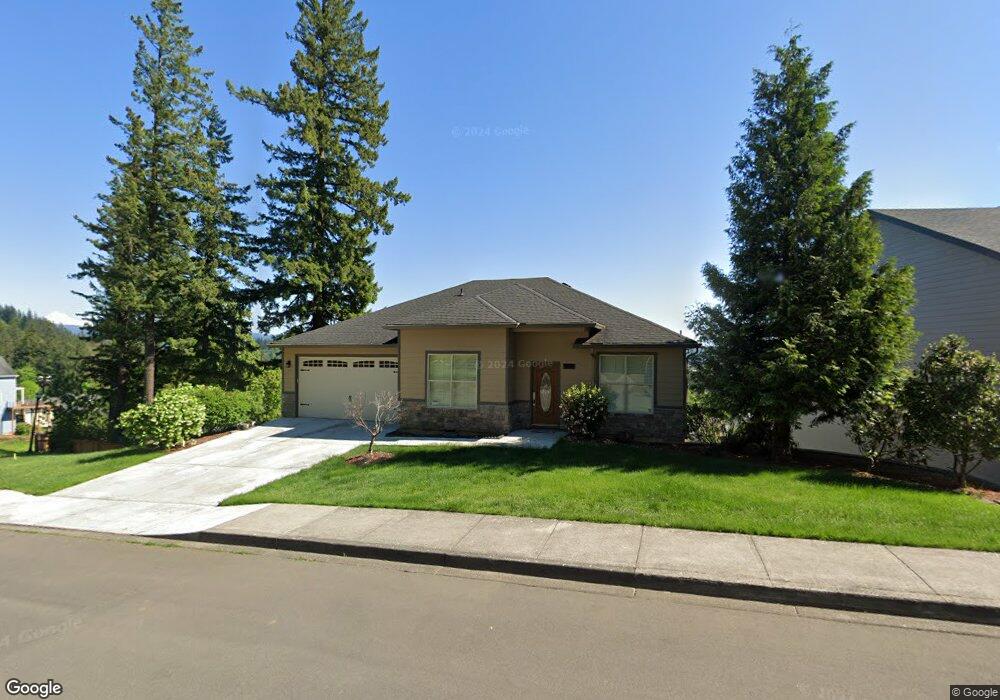
4302 Z St Washougal, WA 98671
Estimated Value: $611,000 - $732,000
4
Beds
3
Baths
3,584
Sq Ft
$183/Sq Ft
Est. Value
About This Home
This home is located at 4302 Z St, Washougal, WA 98671 and is currently estimated at $654,531, approximately $182 per square foot. 4302 Z St is a home located in Clark County with nearby schools including Gause Elementary School, Jemtegaard Middle School, and Washougal High School.
Ownership History
Date
Name
Owned For
Owner Type
Purchase Details
Closed on
Mar 19, 2009
Sold by
National City Bank
Bought by
Sunada Roger T and Sunada Sae A
Current Estimated Value
Home Financials for this Owner
Home Financials are based on the most recent Mortgage that was taken out on this home.
Original Mortgage
$304,071
Outstanding Balance
$192,423
Interest Rate
5.04%
Mortgage Type
FHA
Estimated Equity
$462,108
Purchase Details
Closed on
Dec 17, 2008
Sold by
Deemco Construction Inc
Bought by
National City Bank
Purchase Details
Closed on
Dec 2, 2005
Sold by
C/P 1-97 Washougal Joint Venture
Bought by
Deemco Construction Inc
Home Financials for this Owner
Home Financials are based on the most recent Mortgage that was taken out on this home.
Original Mortgage
$474,000
Interest Rate
8%
Mortgage Type
Construction
Create a Home Valuation Report for This Property
The Home Valuation Report is an in-depth analysis detailing your home's value as well as a comparison with similar homes in the area
Home Values in the Area
Average Home Value in this Area
Purchase History
| Date | Buyer | Sale Price | Title Company |
|---|---|---|---|
| Sunada Roger T | $275,000 | First American Title | |
| National City Bank | $247,500 | First American Title | |
| Deemco Construction Inc | $110,000 | Chicago Title Insurance |
Source: Public Records
Mortgage History
| Date | Status | Borrower | Loan Amount |
|---|---|---|---|
| Open | Sunada Roger T | $304,071 | |
| Previous Owner | Deemco Construction Inc | $474,000 |
Source: Public Records
Tax History Compared to Growth
Tax History
| Year | Tax Paid | Tax Assessment Tax Assessment Total Assessment is a certain percentage of the fair market value that is determined by local assessors to be the total taxable value of land and additions on the property. | Land | Improvement |
|---|---|---|---|---|
| 2025 | $6,191 | $666,014 | $135,000 | $531,014 |
| 2024 | $6,020 | $652,792 | $159,000 | $493,792 |
| 2023 | $5,856 | $664,439 | $169,800 | $494,639 |
| 2022 | $5,888 | $632,882 | $169,800 | $463,082 |
| 2021 | $5,613 | $552,151 | $147,000 | $405,151 |
| 2020 | $5,429 | $493,860 | $135,000 | $358,860 |
| 2019 | $5,542 | $485,182 | $135,000 | $350,182 |
| 2018 | $5,857 | $523,750 | $0 | $0 |
| 2017 | $5,072 | $456,848 | $0 | $0 |
| 2016 | $5,276 | $434,559 | $0 | $0 |
| 2015 | $5,128 | $413,415 | $0 | $0 |
| 2014 | -- | $399,776 | $0 | $0 |
| 2013 | -- | $350,024 | $0 | $0 |
Source: Public Records
Map
Nearby Homes