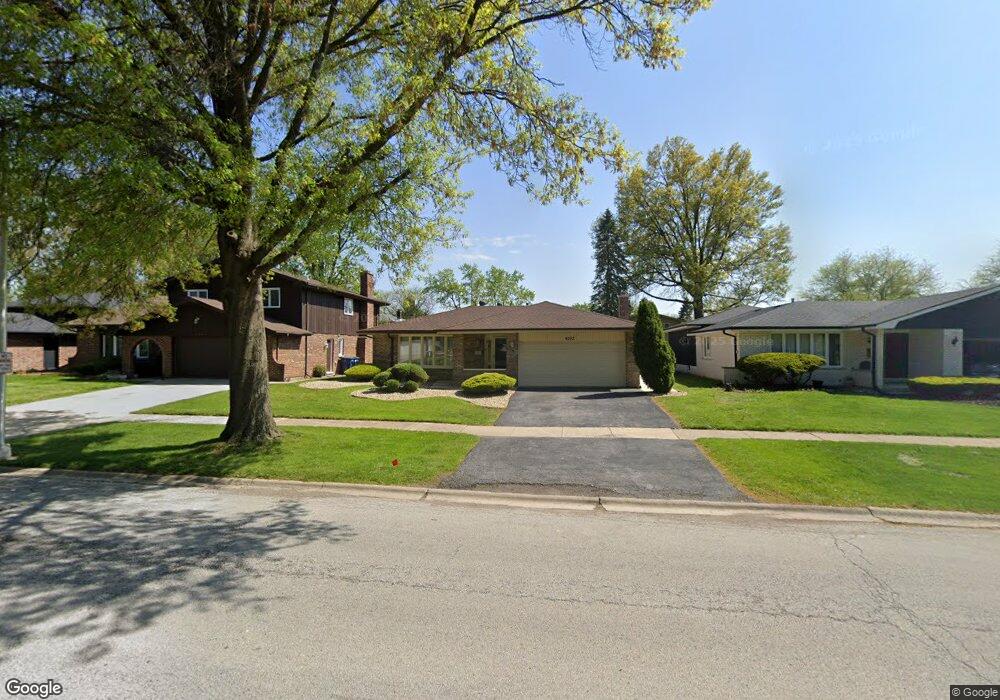
4303 207th St Matteson, IL 60443
Old Matteson NeighborhoodEstimated Value: $280,659 - $313,000
3
Beds
3
Baths
1,820
Sq Ft
$166/Sq Ft
Est. Value
About This Home
This home is located at 4303 207th St, Matteson, IL 60443 and is currently estimated at $302,415, approximately $166 per square foot. 4303 207th St is a home located in Cook County with nearby schools including Illinois School, Arcadia Elementary School, and Indiana Elementary School.
Ownership History
Date
Name
Owned For
Owner Type
Purchase Details
Closed on
Jan 26, 2007
Sold by
Webb Charmaine
Bought by
Bradley Rochelle
Current Estimated Value
Home Financials for this Owner
Home Financials are based on the most recent Mortgage that was taken out on this home.
Original Mortgage
$196,000
Outstanding Balance
$115,724
Interest Rate
6.27%
Mortgage Type
Unknown
Estimated Equity
$186,691
Purchase Details
Closed on
Nov 28, 2005
Sold by
Wells Fargo Bank Minnesota Na
Bought by
Webb Charmaine
Home Financials for this Owner
Home Financials are based on the most recent Mortgage that was taken out on this home.
Original Mortgage
$185,000
Interest Rate
6.4%
Mortgage Type
Unknown
Purchase Details
Closed on
May 19, 2005
Sold by
Harrell Nathaniel
Bought by
Wells Fargo Bank Minnesota Na and Holders Of Option One Loan Trust 2001-C
Create a Home Valuation Report for This Property
The Home Valuation Report is an in-depth analysis detailing your home's value as well as a comparison with similar homes in the area
Home Values in the Area
Average Home Value in this Area
Purchase History
| Date | Buyer | Sale Price | Title Company |
|---|---|---|---|
| Bradley Rochelle | $245,000 | First American Title | |
| Webb Charmaine | $145,000 | Premier Title | |
| Wells Fargo Bank Minnesota Na | -- | -- |
Source: Public Records
Mortgage History
| Date | Status | Borrower | Loan Amount |
|---|---|---|---|
| Open | Bradley Rochelle | $196,000 | |
| Previous Owner | Webb Charmaine | $185,000 |
Source: Public Records
Tax History
| Year | Tax Paid | Tax Assessment Tax Assessment Total Assessment is a certain percentage of the fair market value that is determined by local assessors to be the total taxable value of land and additions on the property. | Land | Improvement |
|---|---|---|---|---|
| 2025 | $7,453 | $24,000 | $3,120 | $20,880 |
| 2024 | $7,453 | $24,000 | $3,120 | $20,880 |
| 2023 | $6,807 | $24,000 | $3,120 | $20,880 |
| 2022 | $6,807 | $18,705 | $2,730 | $15,975 |
| 2021 | $6,990 | $18,704 | $2,730 | $15,974 |
| 2020 | $6,682 | $18,704 | $2,730 | $15,974 |
| 2019 | $5,977 | $17,722 | $2,535 | $15,187 |
| 2018 | $5,971 | $17,722 | $2,535 | $15,187 |
| 2017 | $5,786 | $17,722 | $2,535 | $15,187 |
| 2016 | $6,963 | $16,658 | $2,340 | $14,318 |
| 2015 | $6,841 | $16,658 | $2,340 | $14,318 |
| 2014 | $6,653 | $16,658 | $2,340 | $14,318 |
| 2013 | $6,098 | $16,757 | $2,340 | $14,417 |
Source: Public Records
Map
Nearby Homes
- 722 Kostner Ave
- 4325 Oakwood Ln
- 4110 Applewood Ln
- 831 Violet Ln
- 620 Larkspur Ln
- 4141 204th St
- 744 Academy Ave
- 858 Academy Ave
- 20813 Homeland Rd
- 4613 Lindenwood Ct
- 888 Woodstock Rd
- 20920 Governors Hwy
- 4500 203rd St
- 30 Strauss Ln
- 20601 Parthenon Way
- 154 Sundance Rd
- 153 Treehouse Rd
- 136 Moonlight Rd
- 20120 Keystone Ave
- 20535 Marathon Ct
- 4249 207th St
- 4307 207th St
- 4245 207th St
- 4313 207th St Unit 2
- 4300 Pinewood Ln
- 4306 Pinewood Ln
- 4248 Pinewood Ln
- 4312 Pinewood Ln
- 4241 207th St
- 709 Kostner Ave
- 4242 Pinewood Ln
- 717 Kostner Ave
- 4320 207th St
- 4340 207th St
- 4237 207th St
- 4237 207th St
- 4237 207th St
- 4238 Pinewood Ln
- 4304 207th St
- 4342 207th St
Your Personal Tour Guide
Ask me questions while you tour the home.