Estimated Value: $480,042 - $597,000
4
Beds
3
Baths
2,062
Sq Ft
$267/Sq Ft
Est. Value
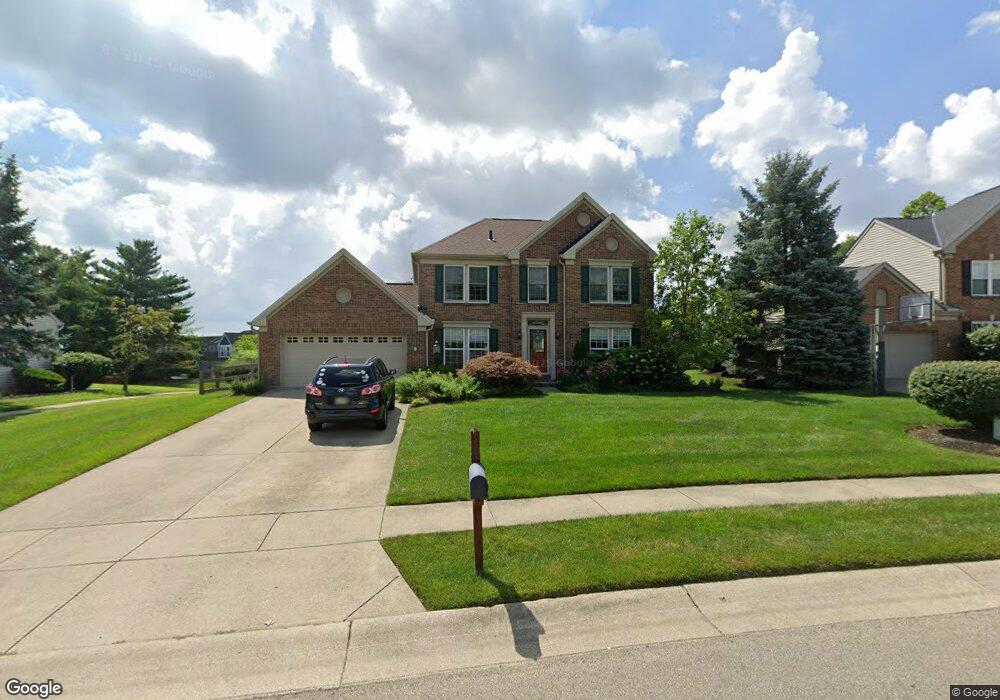
About This Home
This home is located at 4303 Placepointe Dr, Mason, OH 45040 and is currently estimated at $551,011, approximately $267 per square foot. 4303 Placepointe Dr is a home located in Warren County with nearby schools including Mason Intermediate Elementary School, Mason Middle School, and William Mason High School.
Ownership History
Date
Name
Owned For
Owner Type
Purchase Details
Closed on
Jun 22, 2007
Sold by
Gomez Sandra M
Bought by
Ponstingle Timothy D and Ponstingle Jennifer L
Current Estimated Value
Home Financials for this Owner
Home Financials are based on the most recent Mortgage that was taken out on this home.
Original Mortgage
$212,000
Outstanding Balance
$127,683
Interest Rate
6.26%
Mortgage Type
Unknown
Estimated Equity
$423,328
Purchase Details
Closed on
May 14, 2003
Sold by
Patton Brian E and Patton Jill K
Bought by
Gomez Sandra M
Purchase Details
Closed on
Apr 1, 1997
Sold by
Drees Co
Bought by
Sparks Diane
Home Financials for this Owner
Home Financials are based on the most recent Mortgage that was taken out on this home.
Original Mortgage
$155,600
Interest Rate
6.63%
Mortgage Type
New Conventional
Purchase Details
Closed on
Jul 11, 1996
Sold by
Ven Drees Bartlett Joint
Bought by
Drees Co
Create a Home Valuation Report for This Property
The Home Valuation Report is an in-depth analysis detailing your home's value as well as a comparison with similar homes in the area
Home Values in the Area
Average Home Value in this Area
Purchase History
| Date | Buyer | Sale Price | Title Company |
|---|---|---|---|
| Ponstingle Timothy D | $265,000 | Chicago Title | |
| Gomez Sandra M | $243,000 | -- | |
| Sparks Diane | $194,500 | -- | |
| Drees Co | $29,750 | -- |
Source: Public Records
Mortgage History
| Date | Status | Borrower | Loan Amount |
|---|---|---|---|
| Open | Ponstingle Timothy D | $212,000 | |
| Previous Owner | Sparks Diane | $155,600 |
Source: Public Records
Tax History
| Year | Tax Paid | Tax Assessment Tax Assessment Total Assessment is a certain percentage of the fair market value that is determined by local assessors to be the total taxable value of land and additions on the property. | Land | Improvement |
|---|---|---|---|---|
| 2025 | $5,739 | $141,410 | $49,000 | $92,410 |
| 2024 | $5,739 | $141,410 | $49,000 | $92,410 |
| 2023 | $5,070 | $105,525 | $26,845 | $78,680 |
| 2022 | $5,004 | $105,525 | $26,845 | $78,680 |
| 2021 | $4,741 | $105,525 | $26,845 | $78,680 |
| 2020 | $4,685 | $89,429 | $22,750 | $66,679 |
| 2019 | $4,307 | $89,429 | $22,750 | $66,679 |
| 2018 | $4,322 | $89,429 | $22,750 | $66,679 |
| 2017 | $4,028 | $77,809 | $20,895 | $56,914 |
| 2016 | $4,149 | $77,809 | $20,895 | $56,914 |
| 2015 | $4,158 | $77,809 | $20,895 | $56,914 |
| 2014 | $3,981 | $69,470 | $18,660 | $50,820 |
| 2013 | $3,990 | $84,720 | $22,750 | $61,970 |
Source: Public Records
Map
Nearby Homes
- 6725 Ridgefield Ct Unit 147F
- 6674 Villager Place Unit 153D
- 6668 Pondfield Ln
- 4109 Old Manchester Ct
- 6764 Pondfield Ln
- 6768 Pondfield Ln Unit 271E
- 4019 Fieldsedge Dr
- 7162 Scarlet Oak Ct
- 7119 White Oak Ct
- 3856 Sandtrap Cir
- 7149 White Oak Ct Unit 14B
- 4618 Kamm Ln
- 7174 Traditions Turn
- 7154 Traditions Turn
- 7103 Traditions Turn
- 5921 Fairway Dr
- 7153 Traditions Turn
- 7114 Traditions Turn
- 4379 English Oak Ct Unit 38302
- 3634 Pebble Creek Ct
- 4317 Placepointe Dr
- 4285 Placepointe Dr
- 6617 Covefield Ct
- 4261 Eastlake Dr
- 4329 Placepointe Dr
- 4273 Placepointe Dr
- 4263 Eastlake Dr Unit 150B
- 4269 Eastlake Dr Unit 150C
- 4275 Eastlake Dr
- 6677 Ridgefield Ct Unit 146F
- 4274 Placepointe Dr
- 4354 Placepointe Dr
- 4343 Placepointe Dr
- 4225 Eastlake Dr Unit 152E
- 6601 Covefield Ct
- 6683 Ridgefield Ct Unit 146E
- 4223 Eastlake Dr Unit 152D
- 6687 Ridgefield Ct Unit 146D
- 4251 Placepointe Dr
- 4201 Eastlake Dr
Your Personal Tour Guide
Ask me questions while you tour the home.