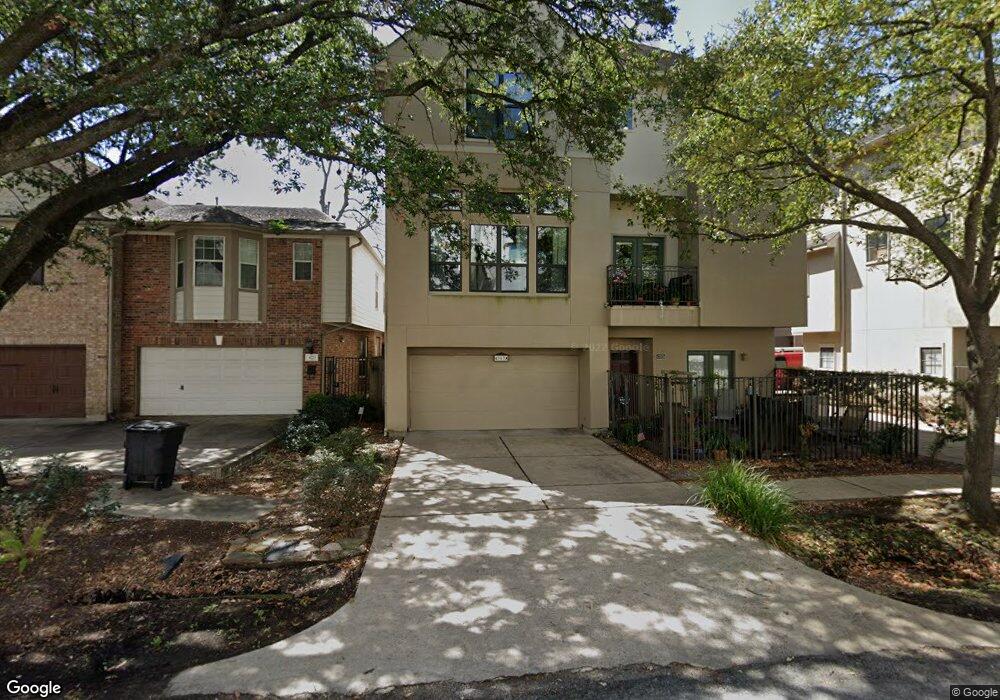
4303 Rose St Unit C Houston, TX 77007
Memorial Heights NeighborhoodEstimated Value: $464,569 - $493,000
3
Beds
4
Baths
2,172
Sq Ft
$220/Sq Ft
Est. Value
About This Home
This home is located at 4303 Rose St Unit C, Houston, TX 77007 and is currently estimated at $478,642, approximately $220 per square foot. 4303 Rose St Unit C is a home located in Harris County with nearby schools including Memorial Elementary School, Hogg Middle, and Heights High School.
Ownership History
Date
Name
Owned For
Owner Type
Purchase Details
Closed on
Feb 23, 2007
Sold by
Ellis Benjamin M and Ellis Laura
Bought by
Alfonzo Alberto J and Reyes Idania D
Current Estimated Value
Home Financials for this Owner
Home Financials are based on the most recent Mortgage that was taken out on this home.
Original Mortgage
$231,920
Outstanding Balance
$139,296
Interest Rate
6.21%
Mortgage Type
New Conventional
Estimated Equity
$339,346
Purchase Details
Closed on
Jul 24, 2003
Sold by
Mora Eric A
Bought by
Ellis Benjamin M
Home Financials for this Owner
Home Financials are based on the most recent Mortgage that was taken out on this home.
Original Mortgage
$220,000
Interest Rate
5.15%
Mortgage Type
Purchase Money Mortgage
Purchase Details
Closed on
May 17, 2002
Sold by
Rose Place Llc
Bought by
Mora Eric A
Home Financials for this Owner
Home Financials are based on the most recent Mortgage that was taken out on this home.
Original Mortgage
$224,900
Interest Rate
8.3%
Create a Home Valuation Report for This Property
The Home Valuation Report is an in-depth analysis detailing your home's value as well as a comparison with similar homes in the area
Home Values in the Area
Average Home Value in this Area
Purchase History
| Date | Buyer | Sale Price | Title Company |
|---|---|---|---|
| Alfonzo Alberto J | -- | American Title Co | |
| Ellis Benjamin M | -- | -- | |
| Mora Eric A | -- | Stewart Title |
Source: Public Records
Mortgage History
| Date | Status | Borrower | Loan Amount |
|---|---|---|---|
| Open | Alfonzo Alberto J | $231,920 | |
| Previous Owner | Ellis Benjamin M | $220,000 | |
| Previous Owner | Mora Eric A | $224,900 | |
| Closed | Ellis Benjamin M | $41,250 |
Source: Public Records
Tax History Compared to Growth
Tax History
| Year | Tax Paid | Tax Assessment Tax Assessment Total Assessment is a certain percentage of the fair market value that is determined by local assessors to be the total taxable value of land and additions on the property. | Land | Improvement |
|---|---|---|---|---|
| 2025 | $6,768 | $462,285 | $194,256 | $268,029 |
| 2024 | $6,768 | $455,414 | $173,808 | $281,606 |
| 2023 | $6,768 | $461,635 | $173,808 | $287,827 |
| 2022 | $9,095 | $415,669 | $173,808 | $241,861 |
| 2021 | $8,752 | $375,499 | $173,808 | $201,691 |
| 2020 | $9,066 | $374,372 | $173,808 | $200,564 |
| 2019 | $9,486 | $374,894 | $173,808 | $201,086 |
| 2018 | $7,325 | $374,894 | $122,688 | $252,206 |
| 2017 | $10,597 | $419,108 | $122,688 | $296,420 |
| 2016 | $10,375 | $419,108 | $122,688 | $296,420 |
| 2015 | $6,831 | $419,108 | $122,688 | $296,420 |
| 2014 | $6,831 | $375,420 | $122,688 | $252,732 |
Source: Public Records
Map
Nearby Homes
- 4215 Lillian St
- 815 Olive St
- 818 Olive St Unit B
- 917 Thompson St
- 4115 Barnes St
- 4402 Lillian St Unit 8
- 4309 Floyd St Unit B
- 4404 Floyd St Unit C
- 806 Jackson Hill St Unit 203
- 4006 Barnes St
- 908 Patterson St
- 918 Patterson St
- 4303 Blossom St
- 904 Patterson St
- 1615 Holly St
- 1102 Thompson St
- 1107 Bonner St
- 4318 Center St
- 4314 Gibson St Unit A
- 4314 Gibson St Unit B
- 4303 Rose St
- 4303 Rose St
- 4303 Rose St
- 4303 Rose St Unit E
- 4303 Rose St
- 4303 Rose St
- 4303 Rose St Unit b
- 4303 Rose St Unit A
- 4303 Rose St Unit B
- 4303 Rose St Unit F
- 4303 Rose St Unit D
- 4317 Rose St
- 4319 Rose St
- 4323 Rose St
- 4223 Rose St
- 4321 Rose St
- 4310 Rose St
- 4310 Rose St Unit B
- 4310 Rose St Unit A
- 4308 Rose St