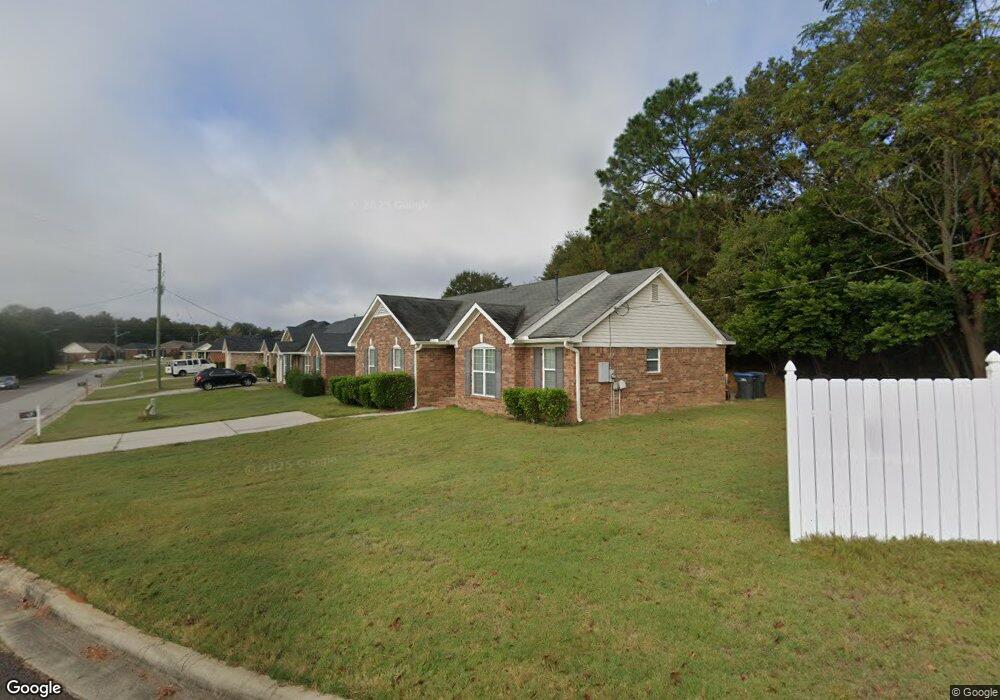
4303 Sanderling Dr Augusta, GA 30906
Richmond Factory NeighborhoodEstimated Value: $198,219 - $225,000
3
Beds
2
Baths
1,412
Sq Ft
$149/Sq Ft
Est. Value
About This Home
This home is located at 4303 Sanderling Dr, Augusta, GA 30906 and is currently estimated at $210,305, approximately $148 per square foot. 4303 Sanderling Dr is a home located in Richmond County with nearby schools including Diamond Lakes Elementary School, Pine Hill Middle School, and Johnson Magnet.
Ownership History
Date
Name
Owned For
Owner Type
Purchase Details
Closed on
Jun 20, 2011
Sold by
Secretary Of Housing And Urban Dev
Bought by
Wells Dapheny
Current Estimated Value
Home Financials for this Owner
Home Financials are based on the most recent Mortgage that was taken out on this home.
Original Mortgage
$85,648
Outstanding Balance
$58,738
Interest Rate
4.75%
Mortgage Type
FHA
Estimated Equity
$151,567
Purchase Details
Closed on
May 4, 2010
Sold by
Citimortgage
Bought by
Hud-Housing Of Urban Dev
Purchase Details
Closed on
Jun 6, 2006
Sold by
Nordahl Homes Inc
Bought by
Furse Elinda A
Home Financials for this Owner
Home Financials are based on the most recent Mortgage that was taken out on this home.
Original Mortgage
$119,194
Interest Rate
6.51%
Mortgage Type
FHA
Purchase Details
Closed on
Jun 10, 2005
Sold by
Price Charles Preston
Bought by
Nordahl Homes Inc
Create a Home Valuation Report for This Property
The Home Valuation Report is an in-depth analysis detailing your home's value as well as a comparison with similar homes in the area
Home Values in the Area
Average Home Value in this Area
Purchase History
| Date | Buyer | Sale Price | Title Company |
|---|---|---|---|
| Wells Dapheny | $84,900 | -- | |
| Hud-Housing Of Urban Dev | -- | -- | |
| Citimortgage Inc | $150,631 | -- | |
| Secretary Of Housing And Urban Dev | -- | -- | |
| Furse Elinda A | $121,100 | None Available | |
| Nordahl Homes Inc | $15,900 | -- |
Source: Public Records
Mortgage History
| Date | Status | Borrower | Loan Amount |
|---|---|---|---|
| Open | Wells Dapheny | $85,648 | |
| Previous Owner | Furse Elinda A | $119,194 |
Source: Public Records
Tax History
| Year | Tax Paid | Tax Assessment Tax Assessment Total Assessment is a certain percentage of the fair market value that is determined by local assessors to be the total taxable value of land and additions on the property. | Land | Improvement |
|---|---|---|---|---|
| 2025 | $2,554 | $77,552 | $6,360 | $71,192 |
| 2024 | $2,554 | $77,632 | $6,360 | $71,272 |
| 2023 | $2,479 | $69,456 | $6,360 | $63,096 |
| 2022 | $1,997 | $57,170 | $6,360 | $50,810 |
| 2021 | $1,660 | $41,130 | $6,360 | $34,770 |
| 2020 | $1,636 | $41,130 | $6,360 | $34,770 |
| 2019 | $1,726 | $41,130 | $6,360 | $34,770 |
| 2018 | $1,737 | $41,130 | $6,360 | $34,770 |
| 2017 | $1,708 | $41,130 | $6,360 | $34,770 |
| 2016 | $1,709 | $41,130 | $6,360 | $34,770 |
| 2015 | $1,720 | $41,130 | $6,360 | $34,770 |
| 2014 | $1,712 | $40,826 | $6,360 | $34,466 |
Source: Public Records
Map
Nearby Homes
- 2264 Basswood Dr
- 2219 Travis Rd
- 4213 Stone Rd
- 4211 Stone Rd
- 2348 Fieldcrest Rd
- 2383 Richwood Dr
- 2104 Travis Rd
- 307 Suncrest Ct
- 304 Suncrest Ct
- 308 Suncrest Ct
- 2264 Nellie Dr
- 4304 Parkwood Dr
- 323 Suncrest Ct
- 328 Suncrest Ct
- 4305 Parkwood Dr
- 4332 Parkwood Dr
- 4104 Short Leaf Ct
- 2323 Woodsman Dr
- 2382 Patrick Ave
- 2317 Hiwatha Dr
- 4305 Sanderling Dr
- 2202 Boykin Rd
- 4307 Sanderling Dr
- 4401 Hatteras Dr
- 2204 Boykin Rd
- 4308 Sanderling Dr
- 2122 Boykin Rd
- 4502 Curriluck Ct
- 4404 Hatteras Dr
- 2206 Boykin Rd
- 4403 Hatteras Dr
- 4312 Sanderling Dr
- 4504 Curriluck Ct
- 2120 Boykin Rd
- 4406 Hatteras Dr
- 4405 Hatteras Dr
- 2208 Boykin Rd
- 4408 Hatteras Dr
- 2118 Boykin Rd
- 4506 Curriluck Ct
Your Personal Tour Guide
Ask me questions while you tour the home.