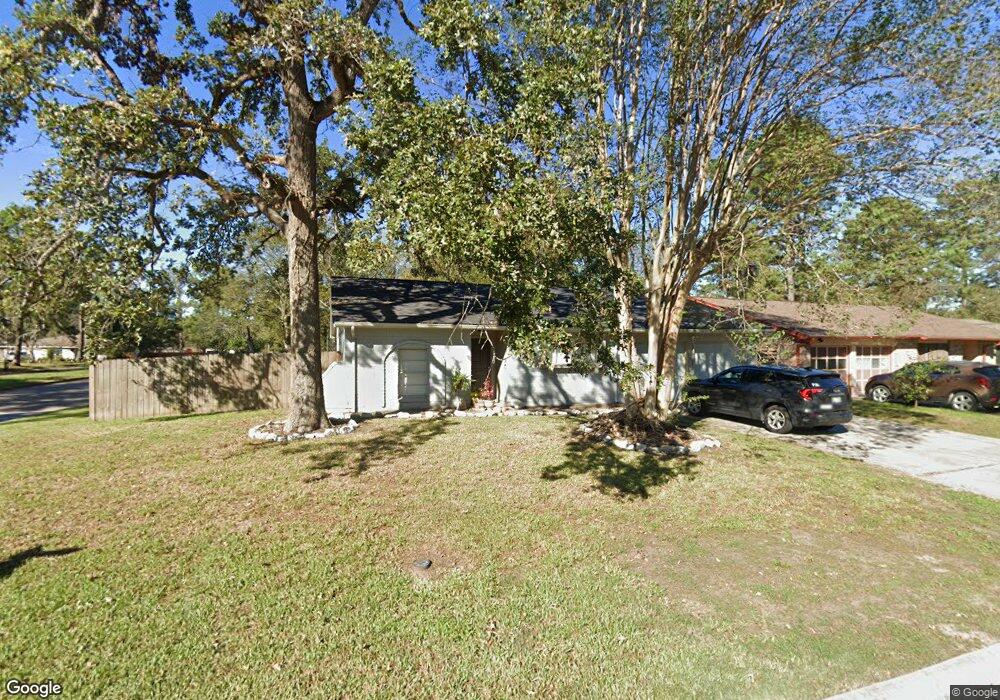
4303 Sloangate Dr Spring, TX 77373
Estimated Value: $201,304 - $223,000
3
Beds
2
Baths
1,637
Sq Ft
$127/Sq Ft
Est. Value
About This Home
This home is located at 4303 Sloangate Dr, Spring, TX 77373 and is currently estimated at $208,576, approximately $127 per square foot. 4303 Sloangate Dr is a home located in Harris County with nearby schools including Mildred Jenkins Elementary School, Dueitt Middle School, and Spring High School.
Ownership History
Date
Name
Owned For
Owner Type
Purchase Details
Closed on
Feb 26, 2015
Sold by
Pacheco Israel
Bought by
Pacheco Israel
Current Estimated Value
Purchase Details
Closed on
Dec 7, 2013
Sold by
Dixon Donita B
Bought by
Pacheco Israel
Purchase Details
Closed on
Apr 8, 2003
Sold by
Lopez Diana
Bought by
Dixon Donita B
Home Financials for this Owner
Home Financials are based on the most recent Mortgage that was taken out on this home.
Original Mortgage
$67,900
Interest Rate
11.25%
Mortgage Type
Credit Line Revolving
Purchase Details
Closed on
Aug 27, 1997
Sold by
Collins Amy Sue and Bradford Amy Sue
Bought by
Dixon Donita B and Lopez Diana F
Home Financials for this Owner
Home Financials are based on the most recent Mortgage that was taken out on this home.
Original Mortgage
$51,300
Interest Rate
7.46%
Create a Home Valuation Report for This Property
The Home Valuation Report is an in-depth analysis detailing your home's value as well as a comparison with similar homes in the area
Home Values in the Area
Average Home Value in this Area
Purchase History
| Date | Buyer | Sale Price | Title Company |
|---|---|---|---|
| Pacheco Israel | -- | None Available | |
| Pacheco Israel | -- | None Available | |
| Dixon Donita B | -- | Fidelity National Title | |
| Dixon Donita B | -- | First American Title |
Source: Public Records
Mortgage History
| Date | Status | Borrower | Loan Amount |
|---|---|---|---|
| Previous Owner | Dixon Donita B | $67,900 | |
| Previous Owner | Dixon Donita B | $51,300 |
Source: Public Records
Tax History Compared to Growth
Tax History
| Year | Tax Paid | Tax Assessment Tax Assessment Total Assessment is a certain percentage of the fair market value that is determined by local assessors to be the total taxable value of land and additions on the property. | Land | Improvement |
|---|---|---|---|---|
| 2025 | $4,955 | $182,538 | $38,962 | $143,576 |
| 2024 | $4,955 | $198,000 | $38,962 | $159,038 |
| 2023 | $4,955 | $189,374 | $38,962 | $150,412 |
| 2022 | $4,681 | $178,062 | $38,962 | $139,100 |
| 2021 | $3,849 | $147,637 | $22,022 | $125,615 |
| 2020 | $3,949 | $141,884 | $22,022 | $119,862 |
| 2019 | $3,779 | $136,478 | $15,246 | $121,232 |
| 2018 | $515 | $103,000 | $15,246 | $87,754 |
| 2017 | $2,938 | $122,395 | $15,246 | $107,149 |
| 2016 | $2,881 | $101,000 | $15,246 | $85,754 |
| 2015 | $2,112 | $99,280 | $15,246 | $84,034 |
| 2014 | $2,112 | $72,857 | $15,246 | $57,611 |
Source: Public Records
Map
Nearby Homes
- 4303 Chestergate Dr
- 4310 Towergate Dr
- 4311 Enchantedgate Dr
- 4330 Tylergate Dr
- 4318 Burkegate Dr
- 4422 Enchantedgate Dr
- 4302 Tylergate Dr
- 23430 Cimber Ln
- 22630 Winter Maple Trail
- 2422 Sheephorn Summit Trail
- 4247 Rosegate Dr
- 4226 Mossygate Dr
- 22431 Gilded Peak Ln
- 2406 High Spruce Cir
- 26114 Halwell Manor Ln
- 2406 Silver Prairie Ln
- 4423 Mossygate Dr
- 4127 Adonis Dr
- 4519 Towergate Dr
- 4523 Towergate Dr
- 4307 Sloangate Dr
- 4302 Chestergate Dr
- 4311 Sloangate Dr
- 4306 Chestergate Dr
- 4302 Sloangate Dr
- 4310 Chestergate Dr
- 4306 Sloangate Dr
- 4315 Sloangate Dr
- 4227 Sloangate Dr
- 4226 Chestergate Dr
- 4310 Sloangate Dr
- 4222 Sloangate Dr
- 4314 Chestergate Dr
- 4319 Sloangate Dr
- 4314 Sloangate Dr
- 4223 Sloangate Dr
- 4303 Towergate Dr
- 4222 Chestergate Dr
- 4318 Chestergate Dr
- 4307 Towergate Dr