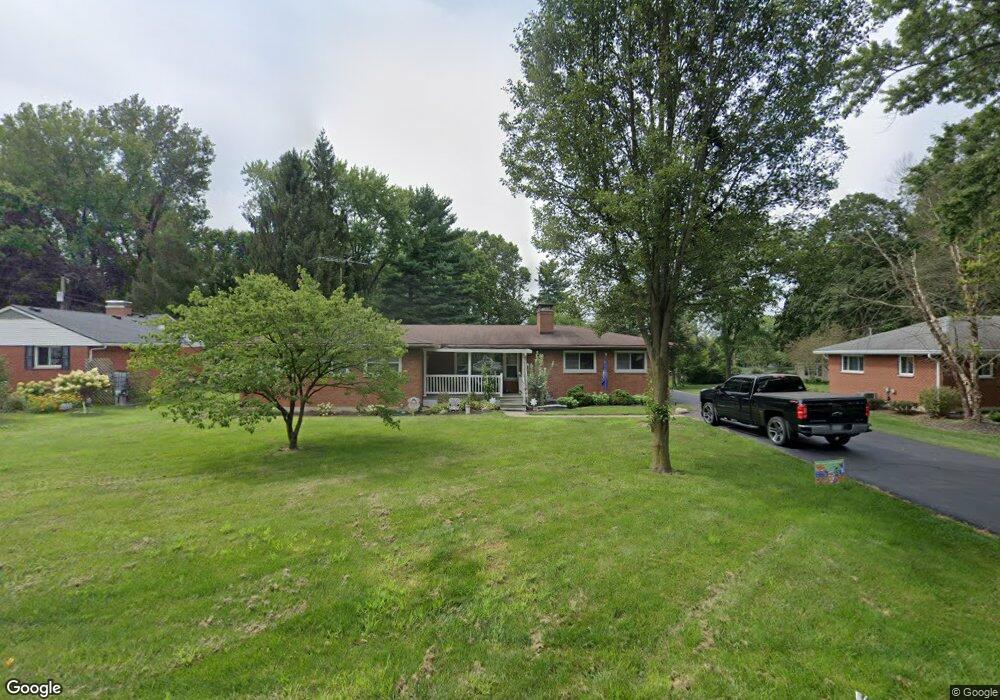
4303 Sunbeam Ave Beavercreek, OH 45440
Estimated Value: $255,000 - $313,000
3
Beds
2
Baths
1,488
Sq Ft
$188/Sq Ft
Est. Value
About This Home
This home is located at 4303 Sunbeam Ave, Beavercreek, OH 45440 and is currently estimated at $280,090, approximately $188 per square foot. 4303 Sunbeam Ave is a home located in Greene County with nearby schools including Bell Creek Intermediate School, Stephen Bell Elementary School, and Bellbrook Middle School.
Ownership History
Date
Name
Owned For
Owner Type
Purchase Details
Closed on
Oct 26, 2019
Sold by
Haws Benjmin S
Bought by
Haws Benjamin S and Haws Nicole
Current Estimated Value
Home Financials for this Owner
Home Financials are based on the most recent Mortgage that was taken out on this home.
Original Mortgage
$159,147
Outstanding Balance
$140,424
Interest Rate
3.75%
Mortgage Type
FHA
Estimated Equity
$139,666
Purchase Details
Closed on
Apr 14, 2017
Sold by
Pollock Mardena S and Pollock James A
Bought by
Haws Benjamin S
Home Financials for this Owner
Home Financials are based on the most recent Mortgage that was taken out on this home.
Original Mortgage
$157,102
Interest Rate
4.87%
Mortgage Type
FHA
Purchase Details
Closed on
Feb 9, 2017
Bought by
Pollock Mardena S
Purchase Details
Closed on
Oct 9, 2000
Sold by
Vansickle Dora Clifford and Vansickle Sarah Jean
Bought by
Vansickle Dora Clifford and Vansickle Sarah J
Create a Home Valuation Report for This Property
The Home Valuation Report is an in-depth analysis detailing your home's value as well as a comparison with similar homes in the area
Home Values in the Area
Average Home Value in this Area
Purchase History
| Date | Buyer | Sale Price | Title Company |
|---|---|---|---|
| Haws Benjamin S | -- | Transtar National Title | |
| Haws Benjamin S | $160,000 | None Available | |
| Pollock Mardena S | -- | -- | |
| Vansickle Dora Clifford | -- | -- |
Source: Public Records
Mortgage History
| Date | Status | Borrower | Loan Amount |
|---|---|---|---|
| Open | Haws Benjamin S | $159,147 | |
| Closed | Haws Benjamin S | $157,102 |
Source: Public Records
Tax History Compared to Growth
Tax History
| Year | Tax Paid | Tax Assessment Tax Assessment Total Assessment is a certain percentage of the fair market value that is determined by local assessors to be the total taxable value of land and additions on the property. | Land | Improvement |
|---|---|---|---|---|
| 2024 | $4,736 | $72,530 | $8,110 | $64,420 |
| 2023 | $4,736 | $72,530 | $8,110 | $64,420 |
| 2022 | $3,972 | $53,700 | $6,240 | $47,460 |
| 2021 | $3,891 | $53,700 | $6,240 | $47,460 |
| 2020 | $3,920 | $53,700 | $6,240 | $47,460 |
| 2019 | $4,038 | $49,480 | $8,270 | $41,210 |
| 2018 | $3,574 | $49,480 | $8,270 | $41,210 |
| 2017 | $2,497 | $49,480 | $8,270 | $41,210 |
| 2016 | $2,498 | $43,030 | $8,270 | $34,760 |
| 2015 | $1,242 | $43,030 | $8,270 | $34,760 |
| 2014 | $2,446 | $43,030 | $8,270 | $34,760 |
Source: Public Records
Map
Nearby Homes
- 4212 Seema Dr
- 470 Cloverhill Ct
- 419 Carleton Dr
- 4227 Wagner Rd
- 4049 Pepperwell Cir
- 4489 Bucksport Ct
- 4493 Bucksport Ct
- 2841 Corlington Dr
- 2816 Corlington Dr
- 3170 E Stroop Rd
- 3170 E Stroop Rd Unit 307
- 3878 Pepperwell Cir
- 3899 Pepperwell Cir
- 3117 Swigert Rd
- 861 Acorn Dr
- 3034 Sandywood Dr
- 3033 Glenmere Ct
- 3073 Santa Rosa Dr
- 3072 Leonora Dr
- 4282 Galway Ct
- 4313 Sunbeam Ave
- 4297 Sunbeam Ave
- 4310 Wagner Rd
- 4300 Wagner Rd
- 472 Wayside Dr
- 4283 Sunbeam Ave
- 4501 Wagner Rd
- 4325 Sunbeam Ave
- 510 Wayside Dr
- 4258 Wagner Rd
- 4308 Sunbeam Ave
- 4296 Sunbeam Ave
- 4318 Sunbeam Ave
- 4286 Sunbeam Ave
- 4271 Sunbeam Ave
- 503 Wayside Dr
- 542 Snyder Ct
- 467 Wayside Dr
- 4328 Sunbeam Ave
- 546 Snyder Ct