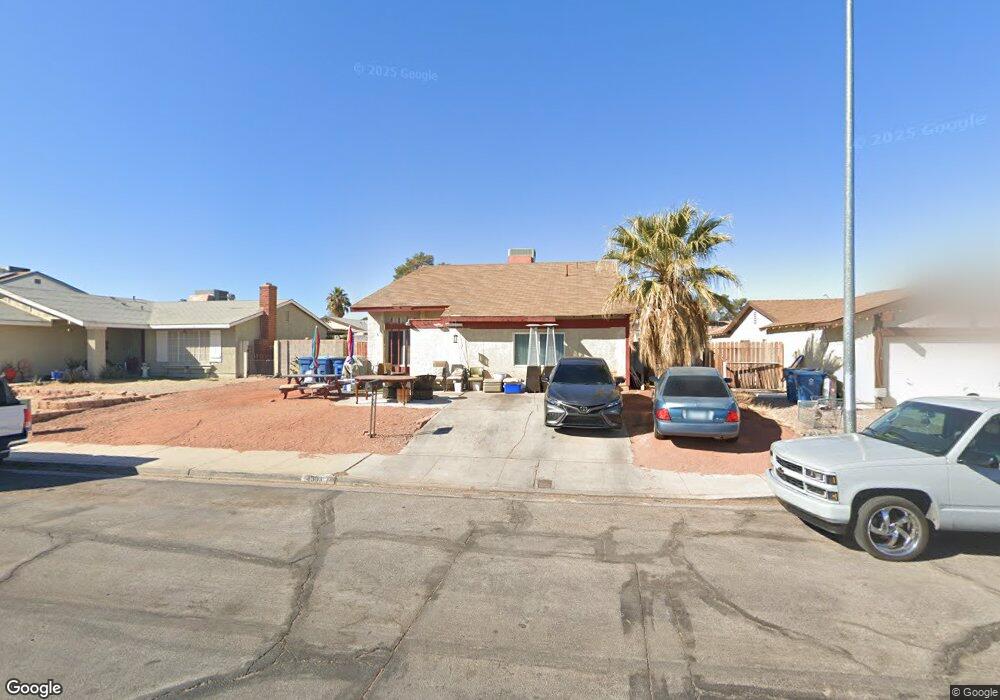
4303 Sunnyview Ct Unit 5 Las Vegas, NV 89147
Estimated Value: $437,399 - $492,000
4
Beds
2
Baths
1,922
Sq Ft
$242/Sq Ft
Est. Value
About This Home
This home is located at 4303 Sunnyview Ct Unit 5, Las Vegas, NV 89147 and is currently estimated at $465,100, approximately $241 per square foot. 4303 Sunnyview Ct Unit 5 is a home located in Clark County with nearby schools including Pat Diskin Elementary School, Clifford J Lawrence Junior High School, and Spring Valley High School.
Ownership History
Date
Name
Owned For
Owner Type
Purchase Details
Closed on
Jun 21, 2011
Sold by
Wells Fargo Bank National Association
Bought by
Chen Peter Che Nan
Current Estimated Value
Purchase Details
Closed on
Jun 28, 2008
Sold by
Tadevosyan Anahit
Bought by
Wells Fargo Bank Na and Morgan Stanley Abs Cap I Inc Tr 2005-Wmc
Purchase Details
Closed on
Mar 31, 2005
Sold by
Sandefur Charles
Bought by
Tadevosyan Anahit
Home Financials for this Owner
Home Financials are based on the most recent Mortgage that was taken out on this home.
Original Mortgage
$216,000
Interest Rate
5.99%
Mortgage Type
Unknown
Purchase Details
Closed on
Aug 17, 2004
Sold by
Sandefur Charles W and Sandefur Gloria
Bought by
Sandefur Charles
Create a Home Valuation Report for This Property
The Home Valuation Report is an in-depth analysis detailing your home's value as well as a comparison with similar homes in the area
Home Values in the Area
Average Home Value in this Area
Purchase History
| Date | Buyer | Sale Price | Title Company |
|---|---|---|---|
| Chen Peter Che Nan | $71,000 | First American Title Paseo | |
| Wells Fargo Bank Na | $165,750 | Fidelity National | |
| Tadevosyan Anahit | $270,000 | Fidelity National Title | |
| Sandefur Charles | -- | -- |
Source: Public Records
Mortgage History
| Date | Status | Borrower | Loan Amount |
|---|---|---|---|
| Previous Owner | Tadevosyan Anahit | $216,000 | |
| Closed | Tadevosyan Anahit | $54,000 |
Source: Public Records
Tax History Compared to Growth
Tax History
| Year | Tax Paid | Tax Assessment Tax Assessment Total Assessment is a certain percentage of the fair market value that is determined by local assessors to be the total taxable value of land and additions on the property. | Land | Improvement |
|---|---|---|---|---|
| 2025 | $1,847 | $67,188 | $37,450 | $29,738 |
| 2024 | $1,711 | $67,188 | $37,450 | $29,738 |
| 2023 | $1,711 | $63,905 | $33,950 | $29,955 |
| 2022 | $1,584 | $56,330 | $28,000 | $28,330 |
| 2021 | $1,467 | $53,233 | $25,550 | $27,683 |
| 2020 | $1,360 | $53,752 | $25,550 | $28,202 |
| 2019 | $1,274 | $49,764 | $21,350 | $28,414 |
| 2018 | $1,216 | $48,121 | $20,300 | $27,821 |
| 2017 | $1,358 | $46,316 | $17,500 | $28,816 |
| 2016 | $1,139 | $44,235 | $14,350 | $29,885 |
| 2015 | $1,136 | $40,592 | $10,850 | $29,742 |
| 2014 | $1,100 | $39,227 | $8,750 | $30,477 |
Source: Public Records
Map
Nearby Homes
- 7285 Pinebrook Cir
- 7229 Pinebrook Cir
- 7227 Galley Dr Unit 6A
- 4343 Chessman Way
- 7324 Empress Dr
- 4454 Honeycomb Dr Unit 9
- 4419 Fairmont Cir
- 7225 Bridgeview Ave
- 7400 W Flamingo Rd Unit 2008
- 7400 W Flamingo Rd Unit 1033
- 4322 Satinwood Dr Unit 9
- 7542 Mycroft Ct
- 4321 Satinwood Dr
- 7507 Mycroft Ct
- 7231 Vireo Dr
- 4502 New Dupell Way
- 4121 Satinwood Dr
- 3974 Round Wood St
- 4276 Aspen St
- 7328 Coffeyville Ave
- 4311 Sunnyview Ct
- 4295 Sunnyview Ct
- 4302 Cloverhill Ct
- 4294 Cloverhill Ct
- 4294 Cloverhill Ct Unit non
- 4294 Cloverhill Ct Unit none
- 4312 Cloverhill Ct
- 4319 Sunnyview Ct
- 4304 Sunnyview Ct
- 4312 Sunnyview Ct
- 4294 Sunnyview Ct
- 4320 Cloverhill Ct
- 4327 Sunnyview Ct
- 4320 Sunnyview Ct
- 7290 Westbrook Ave
- 7290 Westbrook Ave Unit non
- 7290 Westbrook Ave Unit none
- 7300 Westbrook Ave
- 7280 Westbrook Ave