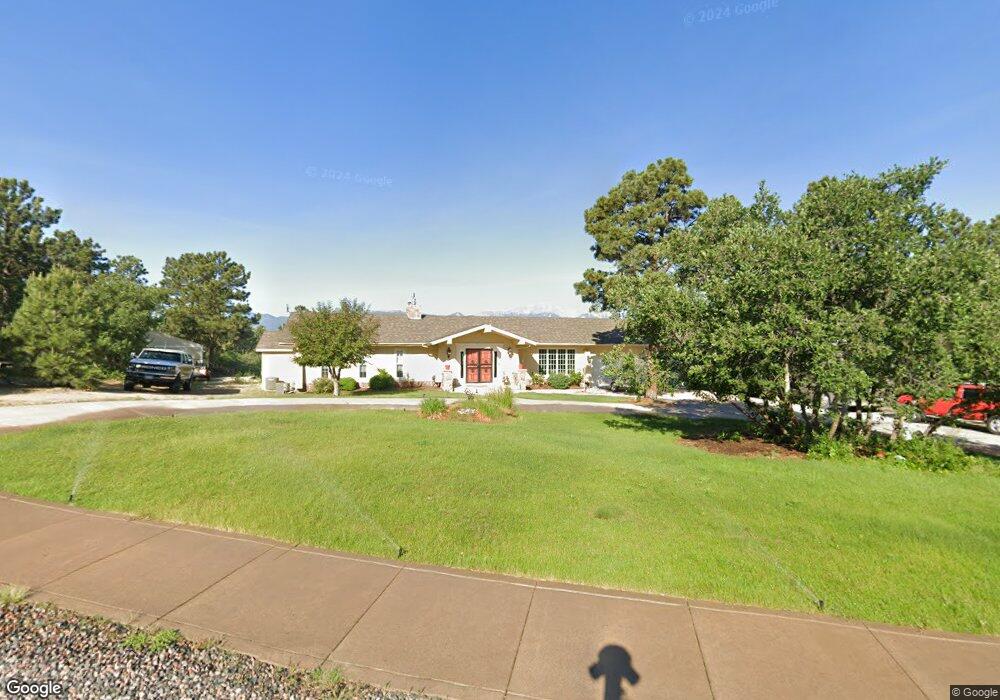
4304 Ridgelane Dr Colorado Springs, CO 80918
Garden Ranch NeighborhoodEstimated Value: $703,000 - $882,000
5
Beds
4
Baths
2,548
Sq Ft
$319/Sq Ft
Est. Value
About This Home
This home is located at 4304 Ridgelane Dr, Colorado Springs, CO 80918 and is currently estimated at $813,064, approximately $319 per square foot. 4304 Ridgelane Dr is a home located in El Paso County with nearby schools including Grant Elementary School, Mann Middle School, and Mitchell High School.
Ownership History
Date
Name
Owned For
Owner Type
Purchase Details
Closed on
Aug 10, 2020
Sold by
Polkow Sheila M
Bought by
Wait Jody E and Russell Robert E
Current Estimated Value
Home Financials for this Owner
Home Financials are based on the most recent Mortgage that was taken out on this home.
Original Mortgage
$740,000
Outstanding Balance
$656,432
Interest Rate
3%
Mortgage Type
VA
Estimated Equity
$156,632
Purchase Details
Closed on
Jun 17, 2003
Sold by
Embery Robert L and Allen Penny L
Bought by
Polkow Gary A and Polkow Sheila M
Home Financials for this Owner
Home Financials are based on the most recent Mortgage that was taken out on this home.
Original Mortgage
$336,800
Interest Rate
5.27%
Mortgage Type
Unknown
Purchase Details
Closed on
May 9, 1994
Sold by
Gibson Harold C and Gibson Lynn Frances
Bought by
Embery Robert L and Allen Penny L
Create a Home Valuation Report for This Property
The Home Valuation Report is an in-depth analysis detailing your home's value as well as a comparison with similar homes in the area
Home Values in the Area
Average Home Value in this Area
Purchase History
| Date | Buyer | Sale Price | Title Company |
|---|---|---|---|
| Wait Jody E | $740,000 | Fidelity National Title | |
| Polkow Gary A | $421,000 | Stewart Title | |
| Embery Robert L | $270,000 | -- |
Source: Public Records
Mortgage History
| Date | Status | Borrower | Loan Amount |
|---|---|---|---|
| Open | Wait Jody E | $740,000 | |
| Previous Owner | Polkow Gary A | $336,800 |
Source: Public Records
Tax History Compared to Growth
Tax History
| Year | Tax Paid | Tax Assessment Tax Assessment Total Assessment is a certain percentage of the fair market value that is determined by local assessors to be the total taxable value of land and additions on the property. | Land | Improvement |
|---|---|---|---|---|
| 2025 | $2,541 | $51,580 | -- | -- |
| 2024 | $2,416 | $50,220 | $7,930 | $42,290 |
| 2023 | $2,416 | $50,220 | $7,930 | $42,290 |
| 2022 | $2,178 | $38,930 | $6,510 | $32,420 |
| 2021 | $2,363 | $40,040 | $6,690 | $33,350 |
| 2020 | $2,164 | $39,030 | $5,920 | $33,110 |
| 2019 | $2,152 | $39,030 | $5,920 | $33,110 |
| 2018 | $1,908 | $33,210 | $4,920 | $28,290 |
| 2017 | $2,308 | $33,210 | $4,920 | $28,290 |
| 2016 | $1,877 | $32,380 | $5,160 | $27,220 |
| 2015 | $1,870 | $32,380 | $5,160 | $27,220 |
| 2014 | $1,788 | $29,710 | $5,160 | $24,550 |
Source: Public Records
Map
Nearby Homes
- 4140 Anitra Cir
- 2727 Flintridge Dr
- 4506 Ridgecrest Dr
- 4295 Ridgecrest Dr
- 4016 Goldenrod Dr
- 3010 Fireweed Dr
- 4410 Moonlight Dr
- 4454 Ranch Cir
- 2520 Hamlet Ln Unit A
- 4434 Misty Dr
- 2562 Blazek Loop
- 2832 Ridgeglen Way
- 2430 Blazek Loop
- 2131 Troy Ct Unit 2131
- 2039 Palm Dr
- 2121 Troy Ct Unit 2121
- 4518 Misty Dr
- 2252 Conservatory Point
- 2355 Troy Ct
- 2328 Troy Ct Unit 2328
- 4306 Ridgelane Dr
- 4300 Ridgelane Dr
- 4305 Ridgelane Dr
- 4307 Ridgelane Dr
- 4303 Ridgelane Dr
- 4309 Ridgelane Dr
- 4308 Ridgelane Dr
- 4224 Anitra Canyon St
- 4311 Ridgelane Dr
- 4221 Anitra Canyon St
- 4310 Meadowview Ct
- 4308 Meadowview Ct
- 4312 Meadowview Ct
- 4304 Meadowview Ct
- 4220 Ridgelane Dr
- 4306 Meadowview Ct
- 4313 Ridgelane Dr
- 4310 Ridgelane Dr
- 4217 Anitra Canyon St
- 4310 Ridgeland Dr