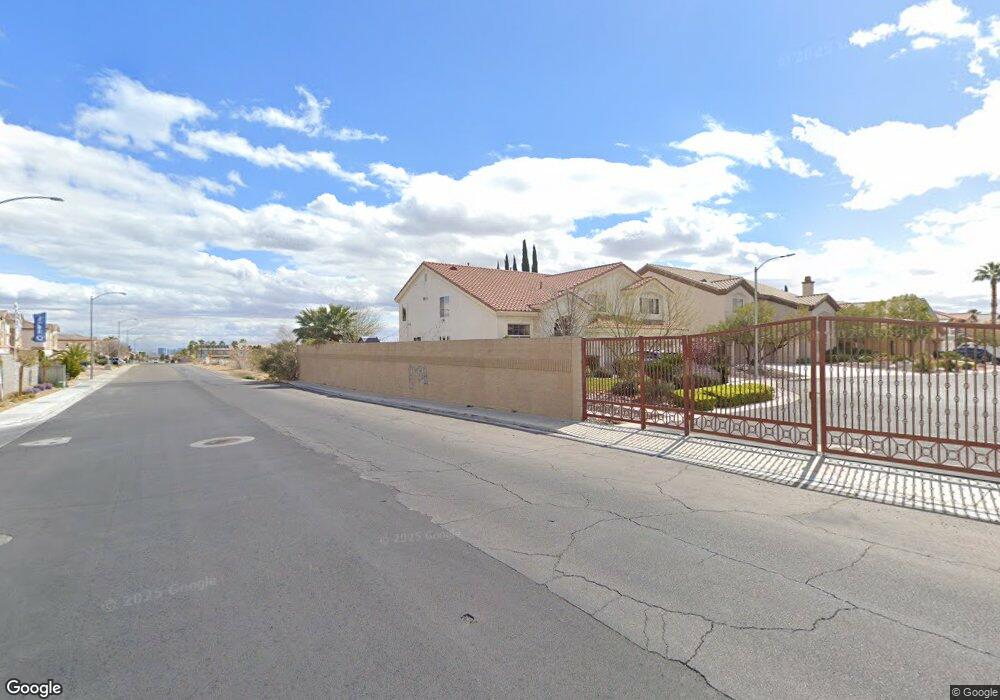
4304 Tall Tree St Las Vegas, NV 89147
Rancho Viejo NeighborhoodEstimated Value: $773,400 - $800,000
5
Beds
4
Baths
3,470
Sq Ft
$229/Sq Ft
Est. Value
About This Home
This home is located at 4304 Tall Tree St, Las Vegas, NV 89147 and is currently estimated at $793,350, approximately $228 per square foot. 4304 Tall Tree St is a home located in Clark County with nearby schools including Patricia A Bendorf Elementary School, Clifford J Lawrence Junior High School, and Spring Valley High School.
Ownership History
Date
Name
Owned For
Owner Type
Purchase Details
Closed on
Jan 23, 2020
Sold by
Le Dam K
Bought by
Nguyen Kimberly Thien and Kcn Irrevocable Trust
Current Estimated Value
Purchase Details
Closed on
Dec 30, 2011
Sold by
Le Muoi
Bought by
Le Dam K
Home Financials for this Owner
Home Financials are based on the most recent Mortgage that was taken out on this home.
Original Mortgage
$200,000
Interest Rate
2.87%
Mortgage Type
Adjustable Rate Mortgage/ARM
Purchase Details
Closed on
Nov 9, 2011
Sold by
Hsbc Bank Usa National Association
Bought by
Le Dam K
Home Financials for this Owner
Home Financials are based on the most recent Mortgage that was taken out on this home.
Original Mortgage
$200,000
Interest Rate
2.87%
Mortgage Type
Adjustable Rate Mortgage/ARM
Purchase Details
Closed on
Apr 19, 2011
Sold by
Chandler Edward O
Bought by
Hsbc Bank Usa National Association
Create a Home Valuation Report for This Property
The Home Valuation Report is an in-depth analysis detailing your home's value as well as a comparison with similar homes in the area
Home Values in the Area
Average Home Value in this Area
Purchase History
| Date | Buyer | Sale Price | Title Company |
|---|---|---|---|
| Nguyen Kimberly Thien | -- | None Available | |
| Le Dam K | -- | Nevada Title Las Vegas | |
| Le Dam K | $250,000 | Nevada Title Las Vegas | |
| Hsbc Bank Usa National Association | $248,038 | Accommodation |
Source: Public Records
Mortgage History
| Date | Status | Borrower | Loan Amount |
|---|---|---|---|
| Previous Owner | Le Dam K | $200,000 |
Source: Public Records
Tax History Compared to Growth
Tax History
| Year | Tax Paid | Tax Assessment Tax Assessment Total Assessment is a certain percentage of the fair market value that is determined by local assessors to be the total taxable value of land and additions on the property. | Land | Improvement |
|---|---|---|---|---|
| 2025 | $3,878 | $193,926 | $62,650 | $131,276 |
| 2024 | $3,765 | $193,926 | $62,650 | $131,276 |
| 2023 | $3,765 | $184,577 | $60,200 | $124,377 |
| 2022 | $3,833 | $160,045 | $46,200 | $113,845 |
| 2021 | $3,711 | $150,282 | $42,000 | $108,282 |
| 2020 | $3,443 | $148,378 | $40,950 | $107,428 |
| 2019 | $3,227 | $145,210 | $39,200 | $106,010 |
| 2018 | $3,079 | $132,760 | $31,150 | $101,610 |
| 2017 | $3,942 | $134,404 | $31,150 | $103,254 |
| 2016 | $2,882 | $129,783 | $25,200 | $104,583 |
| 2015 | $3,151 | $98,209 | $18,200 | $80,009 |
| 2014 | $2,787 | $92,198 | $17,500 | $74,698 |
Source: Public Records
Map
Nearby Homes
- 9024 Alpine Peaks Ave
- 9096 Heavenly Valley Ave
- 4326 Spooner Lake Cir
- 4512 Long Horse Ct
- 4536 Grandspur St
- 8960 Lansberry Ct
- 4604 Barnes Ct
- 8925 W Flamingo Rd Unit 218
- 8925 W Flamingo Rd Unit 306
- 8925 W Flamingo Rd Unit 101
- 8925 W Flamingo Rd Unit 110
- 8925 W Flamingo Rd Unit 228
- 8925 W Flamingo Rd Unit 310
- 8911 Lansberry Ct
- 8880 Flat Sands Ct
- 4607 El Camino Cabos Dr
- 9470 Peace Way Unit 134
- 9470 Peace Way Unit 216
- 9470 Peace Way Unit 206
- 8983 Odense Way
- 4314 Tall Tree St
- 4324 Tall Tree St
- 4305 Tall Tree St
- 4315 Tall Tree St
- 9088 W Rochelle Ave
- 4334 Tall Tree St
- 4325 Tall Tree St
- 9082 W Rochelle Ave
- 4284 Halo Hollyhock St
- 4335 Tall Tree St
- 9076 W Rochelle Ave
- 4344 Tall Tree St
- 9155 W Rochelle Ave
- 9070 W Rochelle Ave Unit 7
- 4345 Tall Tree St
- 9083 Iron Crow Ave
- 9064 W Rochelle Ave Unit 7
- 4354 Tall Tree St
- 9077 Iron Crow Ave
- 4288 Night Star St