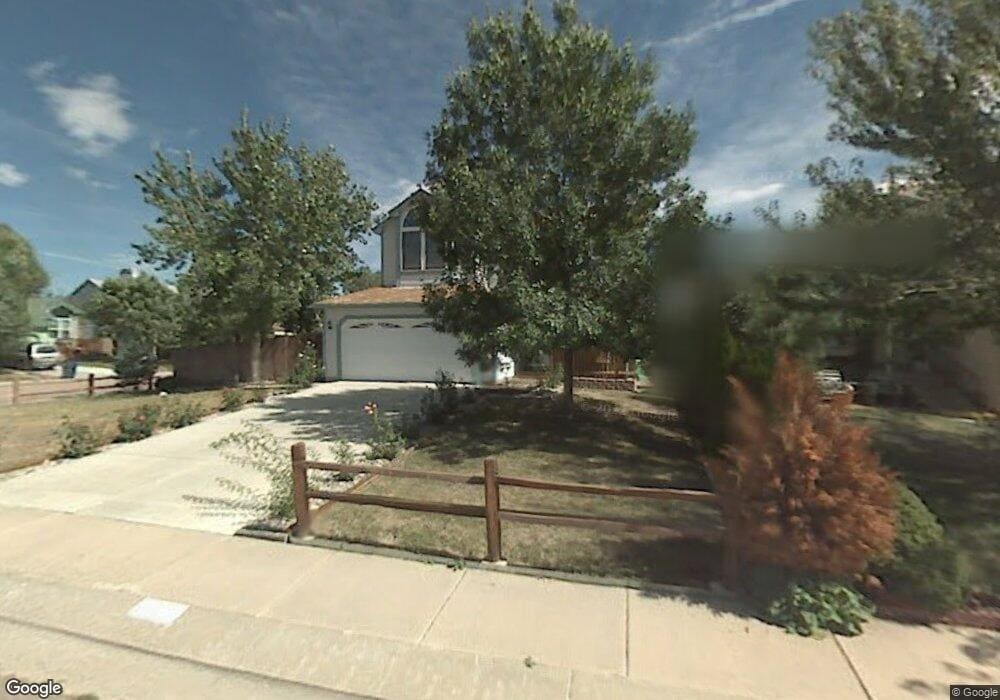
4305 Anvil Dr Colorado Springs, CO 80925
Colorado Centre NeighborhoodEstimated Value: $356,000 - $387,000
3
Beds
1
Bath
1,261
Sq Ft
$295/Sq Ft
Est. Value
About This Home
This home is located at 4305 Anvil Dr, Colorado Springs, CO 80925 and is currently estimated at $371,953, approximately $294 per square foot. 4305 Anvil Dr is a home located in El Paso County with nearby schools including Martin Luther King Jr. Elementary School, Watson Junior High School, and Widefield High School.
Ownership History
Date
Name
Owned For
Owner Type
Purchase Details
Closed on
Oct 28, 2021
Sold by
Sunglieng Kirk P
Bought by
Lemelle Keena D
Current Estimated Value
Home Financials for this Owner
Home Financials are based on the most recent Mortgage that was taken out on this home.
Original Mortgage
$366,000
Outstanding Balance
$334,481
Interest Rate
2.8%
Mortgage Type
VA
Estimated Equity
$37,472
Purchase Details
Closed on
Jun 21, 2004
Sold by
Sunglieng Kirk P and Sunglieng Kelley D
Bought by
Sunglieng Kirk P
Home Financials for this Owner
Home Financials are based on the most recent Mortgage that was taken out on this home.
Original Mortgage
$153,513
Interest Rate
6.3%
Mortgage Type
FHA
Purchase Details
Closed on
May 27, 1995
Sold by
Alexander William P and Alexander Dena K
Bought by
Sunglieng Kirk P and Sunglieng Kelley D
Home Financials for this Owner
Home Financials are based on the most recent Mortgage that was taken out on this home.
Original Mortgage
$91,800
Interest Rate
6.5%
Mortgage Type
VA
Purchase Details
Closed on
Dec 1, 1986
Bought by
Sunglieng Kirk P
Create a Home Valuation Report for This Property
The Home Valuation Report is an in-depth analysis detailing your home's value as well as a comparison with similar homes in the area
Home Values in the Area
Average Home Value in this Area
Purchase History
| Date | Buyer | Sale Price | Title Company |
|---|---|---|---|
| Lemelle Keena D | $366,000 | Stewart Title | |
| Sunglieng Kirk P | -- | Title America | |
| Sunglieng Kirk P | $90,000 | -- | |
| Sunglieng Kirk P | -- | -- |
Source: Public Records
Mortgage History
| Date | Status | Borrower | Loan Amount |
|---|---|---|---|
| Open | Lemelle Keena D | $366,000 | |
| Previous Owner | Sunglieng Kirk P | $153,513 | |
| Previous Owner | Sunglieng Kirk P | $91,800 |
Source: Public Records
Tax History Compared to Growth
Tax History
| Year | Tax Paid | Tax Assessment Tax Assessment Total Assessment is a certain percentage of the fair market value that is determined by local assessors to be the total taxable value of land and additions on the property. | Land | Improvement |
|---|---|---|---|---|
| 2025 | $1,778 | $25,390 | -- | -- |
| 2024 | $1,642 | $26,090 | $5,090 | $21,000 |
| 2023 | $1,642 | $26,090 | $5,090 | $21,000 |
| 2022 | $1,395 | $18,020 | $3,500 | $14,520 |
| 2021 | $1,503 | $18,540 | $3,600 | $14,940 |
| 2020 | $1,357 | $15,270 | $3,150 | $12,120 |
| 2019 | $1,350 | $15,270 | $3,150 | $12,120 |
| 2018 | $1,154 | $12,360 | $2,020 | $10,340 |
| 2017 | $1,165 | $12,360 | $2,020 | $10,340 |
| 2016 | $927 | $11,800 | $1,990 | $9,810 |
| 2015 | $949 | $11,800 | $1,990 | $9,810 |
| 2014 | $901 | $11,290 | $1,990 | $9,300 |
Source: Public Records
Map
Nearby Homes
- 4421 Horizonpoint Dr
- 4332 Levi Ln
- 4404 Bramble Ln
- 9208 Granger Ln
- 4386 Gunbarrel Dr
- 4380 Gunbarrel Dr
- 9328 Chieftan Dr
- 4512 Bramble Ln
- 4548 Bramble Ln
- 9558 Yukon Way
- 4555 Settlement Way
- 9630 Yukon Way
- 9384 Pony Gulch Way
- Arcadia Plan at Meadoworks - Trinity Series
- Canyon Plan at Meadoworks - Yellowstone Series
- Enclave Plan at Meadoworks - Trinity Series
- Sancerre Plan at Meadoworks - Provence Series
- Creekside Plan at Meadoworks - Yellowstone Series
- Hayden Plan at Meadoworks - Yellowstone Series
- St Tropez Plan at Meadoworks - Provence Series
- 4309 Anvil Dr
- 4304 Horizonpoint Dr
- 4313 Anvil Dr
- 4308 Horizonpoint Dr
- 9138 Chieftan Dr
- 4312 Horizonpoint Dr
- 9125 Chieftan Dr
- 4317 Anvil Dr
- 4304 Anvil Dr
- 9142 Chieftan Dr
- 9132 Chieftan Dr
- 4316 Horizonpoint Dr
- 9146 Chieftan Dr
- 9128 Chieftan Dr
- 4321 Anvil Dr
- 4325R Anvil Dr
- 9204 Chieftan Dr
- 9124 Chieftan Dr
- 4316 Anvil Dr
- 4320 Horizonpoint Dr