Estimated Value: $160,885 - $190,000
1
Bed
1
Bath
656
Sq Ft
$265/Sq Ft
Est. Value
About This Home
This home is located at 4305 Bayside Vlg Dr Unit 103, Tampa, FL 33615 and is currently estimated at $173,721, approximately $264 per square foot. 4305 Bayside Vlg Dr Unit 103 is a home located in Hillsborough County with nearby schools including Bay Crest Elementary School, Webb Middle School, and Alonso High School.
Ownership History
Date
Name
Owned For
Owner Type
Purchase Details
Closed on
May 11, 2022
Sold by
Fonseca Francisco P and Fonseca Clara E
Bought by
Forkel Scott
Current Estimated Value
Home Financials for this Owner
Home Financials are based on the most recent Mortgage that was taken out on this home.
Original Mortgage
$159,960
Outstanding Balance
$151,986
Interest Rate
5.27%
Mortgage Type
New Conventional
Estimated Equity
$21,735
Purchase Details
Closed on
Oct 2, 2008
Sold by
Fonseca Francisco P and Fonseca Clara E
Bought by
Fonseca Francisco P and Fonseca Clara E
Purchase Details
Closed on
Aug 22, 2006
Sold by
Tanguay Keith W
Bought by
Fonseca Francisco P and Fonseca Clara E
Purchase Details
Closed on
May 31, 2005
Sold by
Csc Bayside I Lp
Bought by
Tanguay Keith W
Home Financials for this Owner
Home Financials are based on the most recent Mortgage that was taken out on this home.
Original Mortgage
$113,905
Interest Rate
5.75%
Mortgage Type
Fannie Mae Freddie Mac
Create a Home Valuation Report for This Property
The Home Valuation Report is an in-depth analysis detailing your home's value as well as a comparison with similar homes in the area
Home Values in the Area
Average Home Value in this Area
Purchase History
| Date | Buyer | Sale Price | Title Company |
|---|---|---|---|
| Forkel Scott | $186,000 | First American Title | |
| Fonseca Francisco P | -- | None Available | |
| Fonseca Francisco P | $152,000 | Affiliates Title | |
| Tanguay Keith W | $119,900 | Titlesoutheast Inc |
Source: Public Records
Mortgage History
| Date | Status | Borrower | Loan Amount |
|---|---|---|---|
| Open | Forkel Scott | $159,960 | |
| Previous Owner | Tanguay Keith W | $113,905 |
Source: Public Records
Tax History Compared to Growth
Tax History
| Year | Tax Paid | Tax Assessment Tax Assessment Total Assessment is a certain percentage of the fair market value that is determined by local assessors to be the total taxable value of land and additions on the property. | Land | Improvement |
|---|---|---|---|---|
| 2024 | $2,251 | $128,187 | $100 | $128,087 |
| 2023 | $2,137 | $121,237 | $100 | $121,137 |
| 2022 | $1,534 | $111,047 | $100 | $110,947 |
| 2021 | $1,285 | $75,381 | $100 | $75,281 |
| 2020 | $1,263 | $71,435 | $100 | $71,335 |
| 2019 | $1,202 | $70,486 | $100 | $70,386 |
| 2018 | $1,092 | $60,818 | $0 | $0 |
| 2017 | $1,041 | $60,202 | $0 | $0 |
| 2016 | $932 | $42,155 | $0 | $0 |
| 2015 | $868 | $38,323 | $0 | $0 |
| 2014 | $786 | $34,839 | $0 | $0 |
| 2013 | -- | $31,672 | $0 | $0 |
Source: Public Records
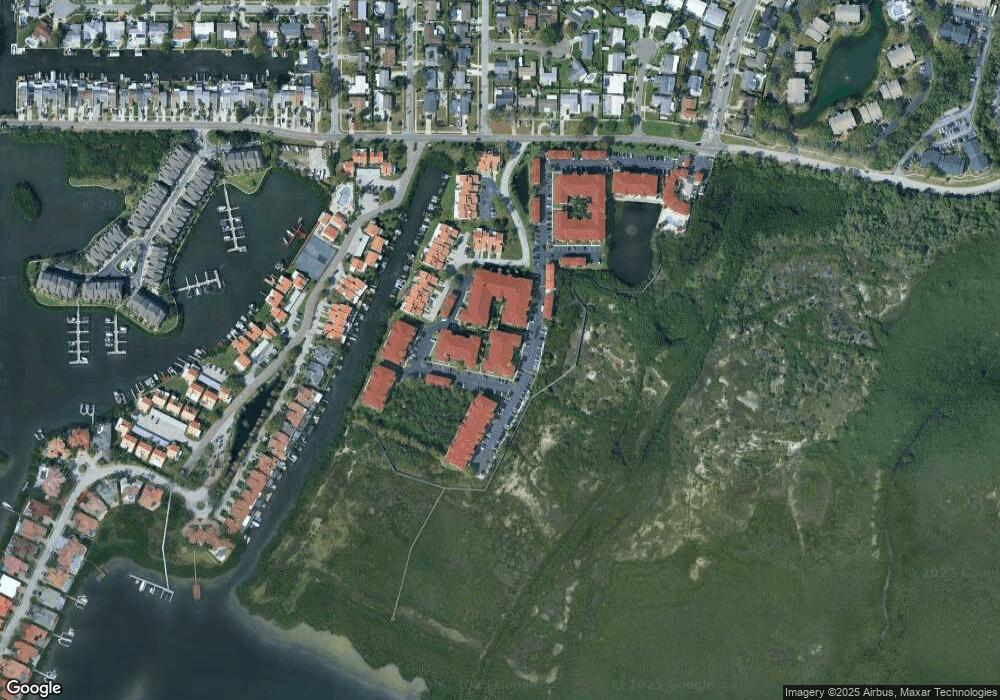
Map
Nearby Homes
- 4305 Bayside Village Dr Unit 104
- 4305 Bayside Village Dr Unit 301
- 4305 Bayside Village Dr Unit 102
- 4307 Bayside Village Dr Unit 103
- 4307 Bayside Village Dr Unit 201
- 4323 Bayside Village Dr Unit 327
- 4323 Bayside Village Dr Unit 206
- 4323 Bayside Village Dr Unit 314
- 4323 Bayside Village Dr Unit 202
- 4345 Bayside Village Dr Unit 102
- 4360 Outrigger Ln
- 4358 Outrigger Ln
- 4312 Bayside Village Dr Unit 302
- 4333 Bayside Village Dr Unit 110
- 4333 Bayside Village Dr Unit 310
- 4333 Bayside Village Dr Unit 228
- 4321 Harbor House Dr
- 4311 Harbor House Dr Unit 11
- 4336 Bayside Village Dr Unit 201
- 4343 Bayside Village Dr Unit 104
- 4305 Bayside Village Dr Unit 5204
- 4305 Bayside Village Dr Unit 302
- 4305 Bayside Village Dr Unit 202
- 4305 Bayside Village Dr Unit 201
- 4305 Bayside Village Dr Unit 304
- 4305 Bayside Village Dr Unit 103
- 4305 Bayside Village Dr Unit 303
- 4305 Bayside Vlg Dr Unit 302
- 4305 Bayside Vlg Dr Unit 105
- 4305 Bayside Vlg Dr Unit 305
- 4305 Bayside Vlg Dr Unit 205
- 4305 Bayside Vlg Dr Unit 203
- 4305 Bayside Vlg Dr Unit 102
- 4305 Bayside Vlg Dr Unit 101
- 4305 Bayside Vlg Dr Unit 204
- 4305 Bayside Vlg Dr Unit 304
- 4305 Bayside Vlg Dr Unit 202
- 4305 Bayside Vlg Dr Unit 201
- 4305 Bayside Vlg Dr Unit 104
- 4305 Bayside Vlg Dr Unit 301