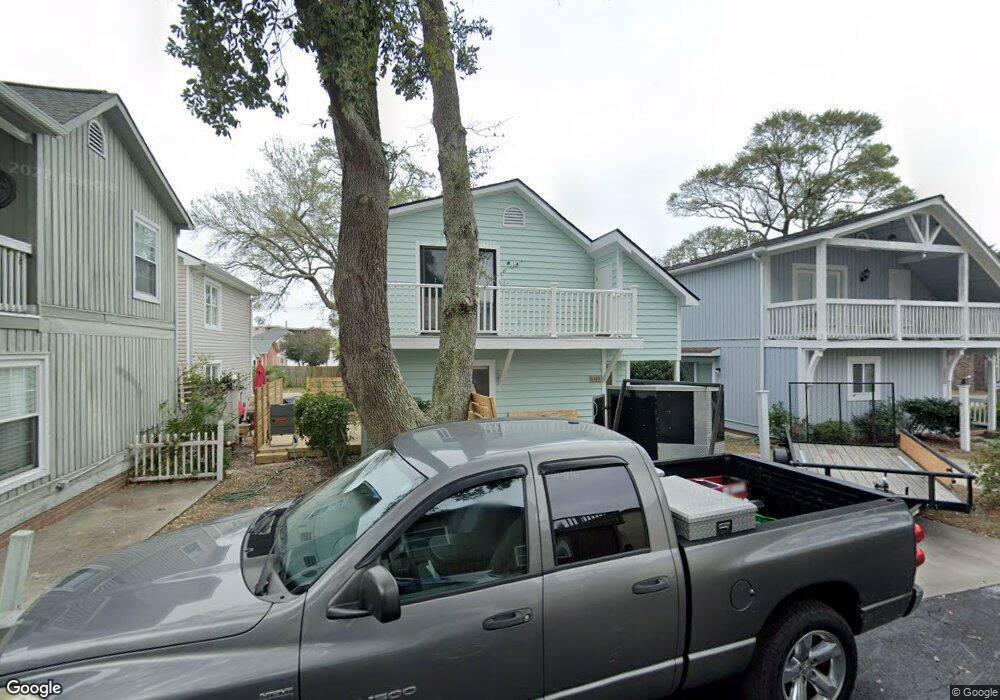
4305 Beverly Ct Unit Ocean Grove, Windy H North Myrtle Beach, SC 29582
Windy Hill NeighborhoodEstimated Value: $474,000 - $510,000
3
Beds
2
Baths
1,482
Sq Ft
$328/Sq Ft
Est. Value
About This Home
This home is located at 4305 Beverly Ct Unit Ocean Grove, Windy H, North Myrtle Beach, SC 29582 and is currently estimated at $485,389, approximately $327 per square foot. 4305 Beverly Ct Unit Ocean Grove, Windy H is a home located in Horry County with nearby schools including Ocean Drive Elementary School, North Myrtle Beach Middle School, and North Myrtle Beach High School.
Ownership History
Date
Name
Owned For
Owner Type
Purchase Details
Closed on
Feb 14, 2017
Sold by
Walker Rebecca W
Bought by
Cohen Diana L and Cohen Steven C
Current Estimated Value
Home Financials for this Owner
Home Financials are based on the most recent Mortgage that was taken out on this home.
Original Mortgage
$170,000
Outstanding Balance
$140,318
Interest Rate
4.09%
Mortgage Type
New Conventional
Estimated Equity
$345,071
Purchase Details
Closed on
Apr 17, 2015
Sold by
Walker Carl A
Bought by
Walker Rebecca W
Purchase Details
Closed on
Jul 1, 2010
Sold by
Nance Jeffrey L
Bought by
Walker Carl A
Purchase Details
Closed on
Apr 16, 2003
Sold by
Pace Jack B and Martha E Pace Revocable Trust
Bought by
Nance Jeffrey L and Nance Betsy E
Home Financials for this Owner
Home Financials are based on the most recent Mortgage that was taken out on this home.
Original Mortgage
$173,850
Interest Rate
5.79%
Mortgage Type
Purchase Money Mortgage
Create a Home Valuation Report for This Property
The Home Valuation Report is an in-depth analysis detailing your home's value as well as a comparison with similar homes in the area
Home Values in the Area
Average Home Value in this Area
Purchase History
| Date | Buyer | Sale Price | Title Company |
|---|---|---|---|
| Cohen Diana L | $217,000 | None Available | |
| Walker Rebecca W | -- | -- | |
| Walker Carl A | $220,000 | -- | |
| Nance Jeffrey L | $183,000 | -- |
Source: Public Records
Mortgage History
| Date | Status | Borrower | Loan Amount |
|---|---|---|---|
| Open | Cohen Diana L | $170,000 | |
| Previous Owner | Nance Jeffrey L | $173,850 |
Source: Public Records
Tax History Compared to Growth
Tax History
| Year | Tax Paid | Tax Assessment Tax Assessment Total Assessment is a certain percentage of the fair market value that is determined by local assessors to be the total taxable value of land and additions on the property. | Land | Improvement |
|---|---|---|---|---|
| 2024 | $3,360 | $30,589 | $19,200 | $11,389 |
| 2023 | $3,360 | $13,510 | $3,004 | $10,506 |
| 2021 | $3,057 | $13,510 | $3,004 | $10,506 |
| 2020 | $3,024 | $13,510 | $3,004 | $10,506 |
| 2019 | $2,917 | $13,510 | $3,004 | $10,506 |
| 2018 | $0 | $13,202 | $3,224 | $9,978 |
| 2017 | -- | $7,477 | $2,149 | $5,328 |
| 2016 | -- | $7,477 | $2,149 | $5,328 |
| 2015 | $1,682 | $7,478 | $2,150 | $5,328 |
| 2014 | $1,628 | $7,478 | $2,150 | $5,328 |
Source: Public Records
Map
Nearby Homes
- 4309 Beverly Ct
- 4314 S Ocean Blvd Unit B-1
- 4302 S Ocean Blvd
- 4311 S Ocean Blvd Unit 701
- 4311 S Ocean Blvd Unit 201
- 4500 S Ocean Blvd Unit 1
- 4500 S Ocean Blvd Unit 9
- Lot 27 Windy Heights Dr
- 4315 S Ocean Blvd Unit 335
- 4315 S Ocean Blvd Unit 136
- 600 43rd Ave S
- 4501 N Ocean Blvd
- 4505 S Ocean Blvd Unit 8D
- 4505 S Ocean Blvd Unit 1E
- 4303 S Ocean Blvd Unit 303
- 4301 S Ocean Blvd Unit 1B
- 4301 S Ocean Blvd Unit 1C
- 4306 Windy Heights Dr
- 4111 S Ocean Blvd Unit 1001
- 4111 S Ocean Blvd Unit 1005