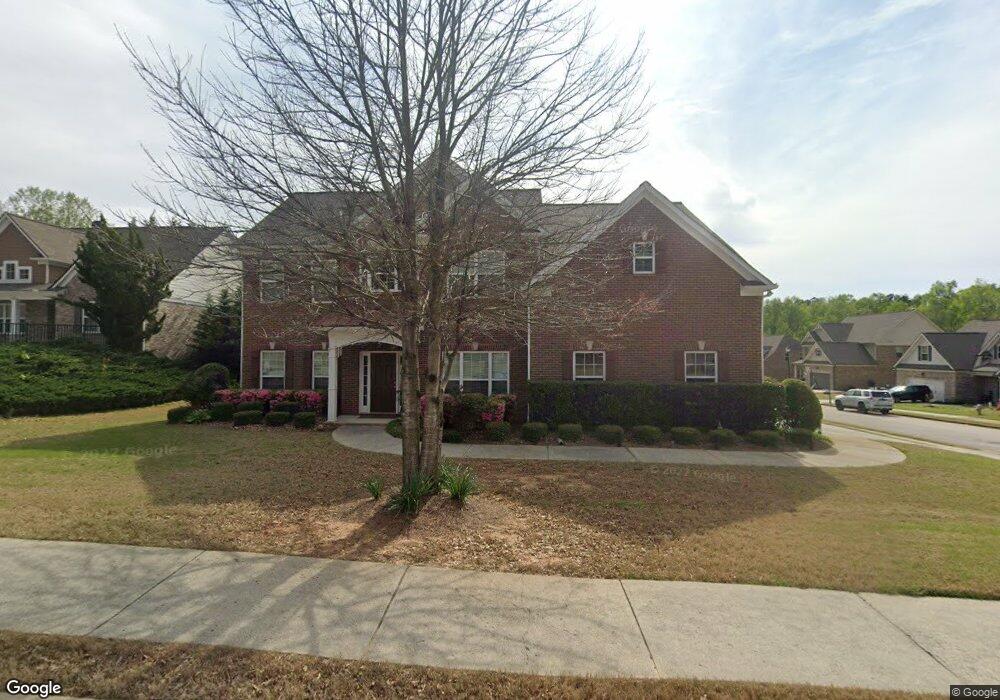
4305 Chesterfield Ct Buford, GA 30518
Estimated Value: $551,149 - $630,000
5
Beds
4
Baths
3,010
Sq Ft
$200/Sq Ft
Est. Value
About This Home
This home is located at 4305 Chesterfield Ct, Buford, GA 30518 and is currently estimated at $600,537, approximately $199 per square foot. 4305 Chesterfield Ct is a home located in Hall County with nearby schools including Buford Elementary School, Buford Academy, and Buford Senior Academy.
Ownership History
Date
Name
Owned For
Owner Type
Purchase Details
Closed on
May 17, 2010
Sold by
Cohen Richard
Bought by
Cohen Richard and Vargas Angela
Current Estimated Value
Home Financials for this Owner
Home Financials are based on the most recent Mortgage that was taken out on this home.
Original Mortgage
$220,802
Outstanding Balance
$151,218
Interest Rate
5.5%
Mortgage Type
FHA
Estimated Equity
$449,319
Purchase Details
Closed on
Aug 28, 2009
Sold by
Brentwood Builders Llc
Bought by
Cohen Richard
Home Financials for this Owner
Home Financials are based on the most recent Mortgage that was taken out on this home.
Original Mortgage
$214,230
Interest Rate
6.49%
Mortgage Type
Trade
Purchase Details
Closed on
Aug 25, 2009
Sold by
Mb Regional Enterprises Llc
Bought by
Brentwood Builders Llc
Home Financials for this Owner
Home Financials are based on the most recent Mortgage that was taken out on this home.
Original Mortgage
$214,230
Interest Rate
6.49%
Mortgage Type
Trade
Purchase Details
Closed on
Aug 13, 2007
Sold by
Mb Regional Enterprises Llc
Bought by
Mb Regional Enterprises Llc & Brentwood
Create a Home Valuation Report for This Property
The Home Valuation Report is an in-depth analysis detailing your home's value as well as a comparison with similar homes in the area
Home Values in the Area
Average Home Value in this Area
Purchase History
| Date | Buyer | Sale Price | Title Company |
|---|---|---|---|
| Cohen Richard | -- | -- | |
| Cohen Richard | -- | -- | |
| Cohen Richard | $222,000 | -- | |
| Brentwood Builders Llc | -- | -- | |
| Mb Regional Enterprises Llc & Brentwood | $540,000 | -- |
Source: Public Records
Mortgage History
| Date | Status | Borrower | Loan Amount |
|---|---|---|---|
| Open | Cohen Richard | $220,802 | |
| Previous Owner | Cohen Richard | $214,230 |
Source: Public Records
Tax History Compared to Growth
Tax History
| Year | Tax Paid | Tax Assessment Tax Assessment Total Assessment is a certain percentage of the fair market value that is determined by local assessors to be the total taxable value of land and additions on the property. | Land | Improvement |
|---|---|---|---|---|
| 2024 | $3,897 | $199,920 | $34,000 | $165,920 |
| 2023 | $1,455 | $190,120 | $34,000 | $156,120 |
| 2022 | $1,471 | $162,680 | $34,000 | $128,680 |
| 2021 | $1,225 | $128,960 | $23,000 | $105,960 |
| 2020 | $1,050 | $127,560 | $20,000 | $107,560 |
| 2019 | $1,127 | $113,440 | $20,000 | $93,440 |
| 2018 | $1,034 | $101,680 | $20,000 | $81,680 |
| 2017 | $969 | $91,920 | $20,000 | $71,920 |
| 2016 | $790 | $82,600 | $14,000 | $68,600 |
| 2015 | $780 | $80,600 | $12,000 | $68,600 |
| 2014 | $780 | $80,600 | $12,000 | $68,600 |
Source: Public Records
Map
Nearby Homes
- 4229 Brentwood Dr
- 4311 Chesterfield Ct
- 4245 Brentwood Dr
- 4308 Chesterfield Ct Unit 23
- 4308 Chesterfield Ct
- 4225 Brentwood Dr
- 4234 Brentwood Dr
- 4234 Brentwood Dr Unit 14
- 4315 Chesterfield Ct
- 4238 Brentwood Dr Unit 15
- 4238 Brentwood Dr
- 4249 Brentwood Dr
- 4255 Crestwood Bend Cir
- 4230 Brentwood Dr
- 4230 Brentwood Dr Unit 13A
- 4312 Chesterfield Ct Unit 24
- 4312 Chesterfield Ct
- 4242 Brentwood Dr
- 4251 Crestwood Bend Cir
- 4226 Brentwood Dr