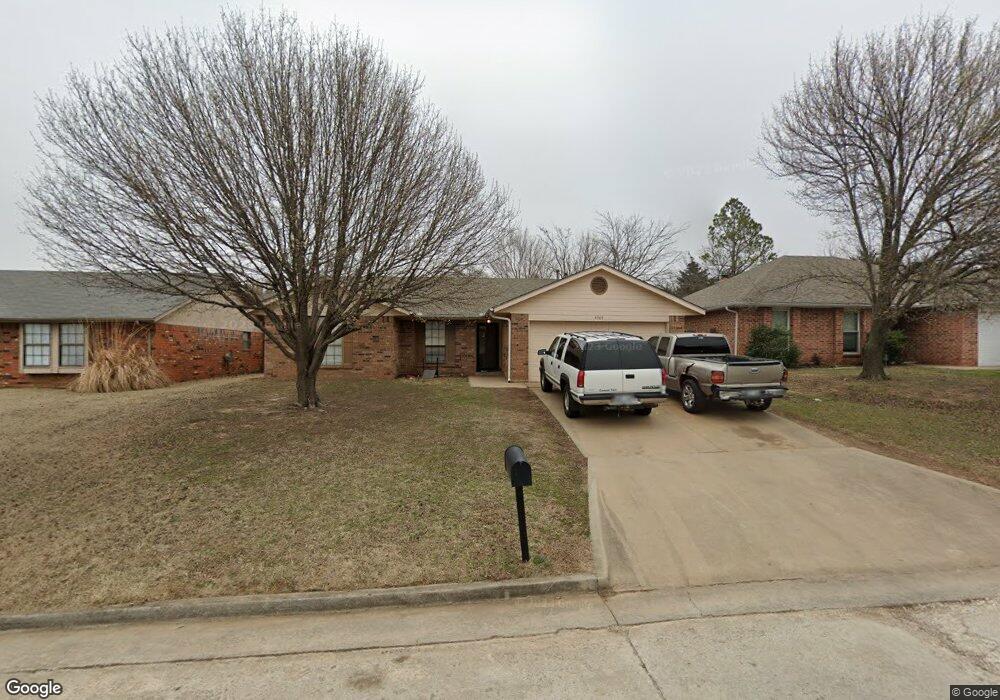
4305 N Trinity Dr Shawnee, OK 74804
Estimated Value: $168,000 - $199,000
3
Beds
2
Baths
1,408
Sq Ft
$129/Sq Ft
Est. Value
About This Home
This home is located at 4305 N Trinity Dr, Shawnee, OK 74804 and is currently estimated at $181,997, approximately $129 per square foot. 4305 N Trinity Dr is a home located in Pottawatomie County.
Ownership History
Date
Name
Owned For
Owner Type
Purchase Details
Closed on
Mar 23, 2015
Sold by
Albers Burt William and Albers Lingju
Bought by
Albers Burt William and Albers Lingju
Current Estimated Value
Purchase Details
Closed on
Feb 9, 2015
Sold by
Secretary Of Housing & Urban Development
Bought by
Albers Burt William
Purchase Details
Closed on
Sep 15, 2014
Sold by
Sheriff
Bought by
Secretary Of Housing & Urban Developme
Purchase Details
Closed on
Feb 28, 2005
Sold by
Adams Larry D
Bought by
Ingraham Wallace S and Ingraham Amber R
Home Financials for this Owner
Home Financials are based on the most recent Mortgage that was taken out on this home.
Original Mortgage
$95,742
Interest Rate
5.71%
Mortgage Type
FHA
Purchase Details
Closed on
Jun 29, 2001
Sold by
Brown Tom and Brown Carol
Bought by
Adams Larry D
Purchase Details
Closed on
Jun 10, 1994
Sold by
Brad Henry C and Brad Brad
Bought by
Brown Tom and Brown Carole
Create a Home Valuation Report for This Property
The Home Valuation Report is an in-depth analysis detailing your home's value as well as a comparison with similar homes in the area
Purchase History
| Date | Buyer | Sale Price | Title Company |
|---|---|---|---|
| Albers Burt William | -- | None Available | |
| Albers Burt William | -- | First American Title | |
| Secretary Of Housing & Urban Developme | -- | -- | |
| Ingraham Wallace S | $96,500 | None Available | |
| Adams Larry D | $89,000 | -- | |
| Brown Tom | $69,000 | -- |
Source: Public Records
Mortgage History
| Date | Status | Borrower | Loan Amount |
|---|---|---|---|
| Previous Owner | Ingraham Wallace S | $95,742 |
Source: Public Records
Tax History
| Year | Tax Paid | Tax Assessment Tax Assessment Total Assessment is a certain percentage of the fair market value that is determined by local assessors to be the total taxable value of land and additions on the property. | Land | Improvement |
|---|---|---|---|---|
| 2025 | $1,171 | $13,104 | $1,732 | $11,372 |
| 2024 | $1,130 | $12,480 | $1,650 | $10,830 |
| 2023 | $1,130 | $11,886 | $1,560 | $10,326 |
| 2022 | $1,055 | $11,320 | $1,560 | $9,760 |
| 2021 | $1,014 | $10,781 | $1,560 | $9,221 |
| 2020 | $1,028 | $10,946 | $1,560 | $9,386 |
| 2019 | $1,071 | $11,277 | $1,560 | $9,717 |
| 2018 | $1,109 | $11,608 | $1,560 | $10,048 |
| 2017 | $1,131 | $11,940 | $1,560 | $10,380 |
| 2016 | $1,177 | $12,287 | $1,080 | $11,207 |
| 2015 | $1,027 | $12,145 | $1,080 | $11,065 |
| 2014 | $978 | $11,567 | $1,080 | $10,487 |
Source: Public Records
Map
Nearby Homes
- 4315 N Liberty Cir
- 2253 Gray Dove Dr
- 106 Willow Grove Ln
- 134 Willow Grove Ln
- 00 N Bryan - 100 Acres Ave
- 0 E 45th St
- 1104 Adeline
- 2205 Copper Creek Ln
- 16 Orlando Dr
- 43512 E 45th St
- 14985 White Oak Ln
- 4509 Gracelann
- 4505 Churchill
- 4601 Churchill
- 4513 Churchill
- 1611 Lady St
- 2704 Woodlawn Ct
- 3 Del Rancho Ln
- 9 Castle Creek Place
- 4525 Red Bird Rd
- 4303 N Trinity Dr
- 4307 N Trinity Dr
- 2325 E Liberty St
- 4306 N Eric Dr
- 4309 N Trinity Dr
- 4304 N Trinity Dr
- 4302 N Trinity Dr
- 4306 N Trinity Dr
- 4316 Trinity Dr
- 4311 N Trinity Dr
- 4308 N Trinity Dr
- 2327 E Liberty St
- 4308 Eric Dr
- 4310 N Eric Dr
- 4310 N Trinity Dr
- 4313 N Trinity Dr
- 2329 E Liberty St
- 4309 N Eric Dr
- 4335 N Liberty Cir
- 4312 N Trinity Dr
Your Personal Tour Guide
Ask me questions while you tour the home.