4306 Cortez Rd Brooklyn, MD 21225
Estimated Value: $163,000 - $212,000
About This Home
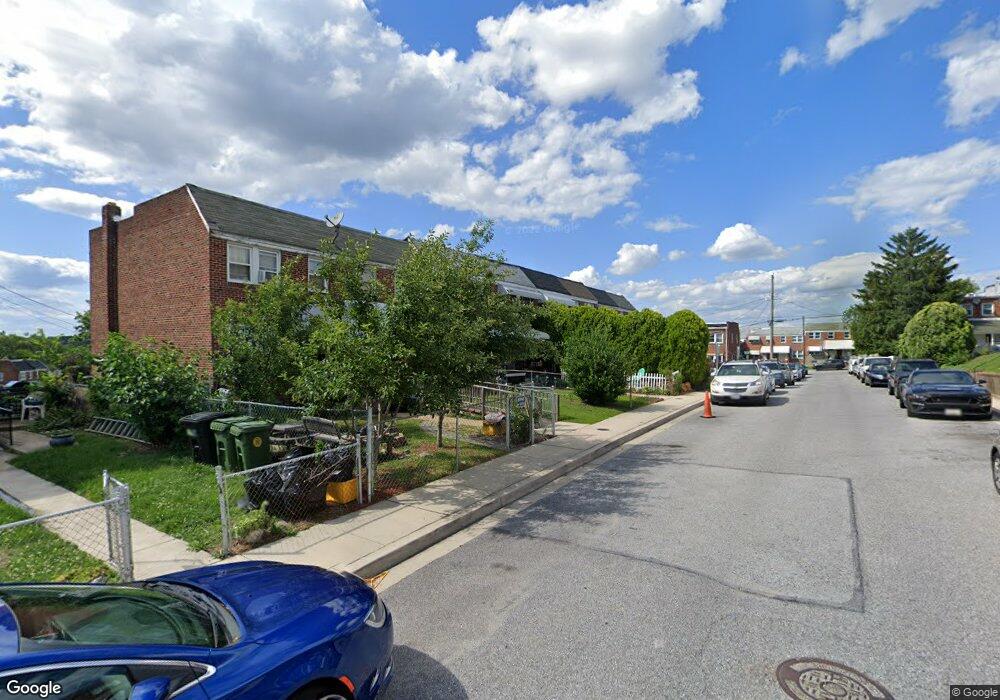
This home is located at 4306 Cortez Rd, Brooklyn, MD 21225 and is currently estimated at $181,242, approximately $182 per square foot. 4306 Cortez Rd is a home located in Anne Arundel County with nearby schools including Belle Grove Elementary School, Brooklyn Park Middle School, and North County High School.
Ownership History
We collect this data history from publicly available records. To have your information removed, we recommend requesting removal directly through your county’s website.
Purchase Details
Purchase Details
Purchase Details
Home Financials for this Owner
Home Financials are based on the most recent Mortgage that was taken out on this home.Purchase Details
Purchase Details
Purchase Details
Home Values in the Area
Average Home Value in this Area
Purchase History
We collect this data history from publicly available records. To have your information removed, we recommend requesting removal directly through your county’s website.
| Date | Buyer | Sale Price | Title Company |
|---|---|---|---|
| -- | None Available | ||
| -- | None Available | ||
| $160,000 | -- | ||
| $84,200 | -- | ||
| $77,000 | -- | ||
| -- | -- |
Mortgage History
We collect this data history from publicly available records. To have your information removed, we recommend requesting removal directly through your county’s website.
| Date | Status | Borrower | Loan Amount |
|---|---|---|---|
| Open | $157,102 |
Tax History
We collect this data history from publicly available records. To have your information removed, we recommend requesting removal directly through your county’s website.
| Year | Tax Paid | Tax Assessment Tax Assessment Total Assessment is a certain percentage of the fair market value that is determined by local assessors to be the total taxable value of land and additions on the property. | Land | Improvement |
|---|---|---|---|---|
| 2025 | $1,826 | $129,800 | $30,000 | $99,800 |
| 2024 | $1,826 | $126,300 | -- | -- |
| 2023 | $1,758 | $122,800 | $0 | $0 |
| 2022 | $1,623 | $119,300 | $40,000 | $79,300 |
| 2020 | $1,566 | $117,833 | $0 | $0 |
| 2019 | $1,560 | $117,100 | $40,000 | $77,100 |
| 2018 | $1,166 | $114,967 | $0 | $0 |
| 2017 | $1,469 | $112,833 | $0 | $0 |
| 2016 | -- | $110,700 | $0 | $0 |
| 2015 | -- | $103,833 | $0 | $0 |
| 2014 | -- | $96,967 | $0 | $0 |
Map
- 212 W Riverview Rd
- 336 Arden Rd W
- 322 Arundel Rd W
- 214 Old Riverside Rd
- 17 2nd Ave
- 130 W Edgevale Rd
- 237 W Meadow Rd
- 4106 Ritchie Hwy
- 102 7th Ave
- 3916 Potee St
- 2 W Jeffrey St
- 103 9th Ave
- 5614 Cliff Side Ct
- 207 W 11th Ave
- 906 1st St
- 4013 4th St
- 3642 S Hanover St
- Lot 10, 11 W Patapsco Ave
- 3614 2nd St
- 932 1st St
- 307 W Riverview Rd
- 309 W Riverview Rd
- 305 W Riverview Rd
- 311 W Riverview Rd
- 303 W Riverview Rd
- 313 W Riverview Rd
- 301 W Riverview Rd
- 315 W Riverview Rd
- 4300 Cortez Rd
- 4302 Cortez Rd
- 317 W Riverview Rd
- 4304 Cortez Rd
- 319 W Riverview Rd
- 213 W Riverview Rd
- 321 W Riverview Rd
- 306 Grove Park Rd
- 4308 Cortez Rd
- 323 W Riverview Rd
- 211 W Riverview Rd
- 308 Grove Park Rd
Ask me questions while you tour the home.