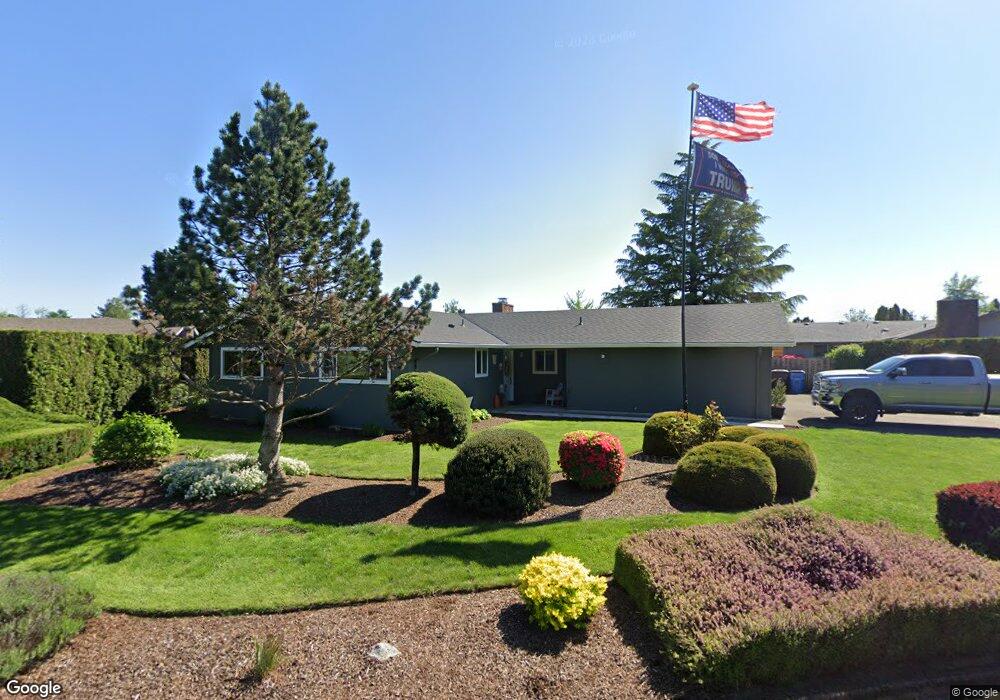
4306 F Cir Washougal, WA 98671
Estimated Value: $482,000 - $570,000
3
Beds
3
Baths
1,389
Sq Ft
$366/Sq Ft
Est. Value
About This Home
This home is located at 4306 F Cir, Washougal, WA 98671 and is currently estimated at $507,957, approximately $365 per square foot. 4306 F Cir is a home located in Clark County with nearby schools including Columbia River Gorge Elementary School, Jemtegaard Middle School, and Washougal High School.
Ownership History
Date
Name
Owned For
Owner Type
Purchase Details
Closed on
Apr 9, 2019
Sold by
Weissenfluh Ryan J and Weissenfluh Lindsay C
Bought by
Weissenfluh Ryan J and Weissenfluh Lindsay C
Current Estimated Value
Home Financials for this Owner
Home Financials are based on the most recent Mortgage that was taken out on this home.
Original Mortgage
$256,000
Outstanding Balance
$225,070
Interest Rate
4.3%
Mortgage Type
New Conventional
Estimated Equity
$282,888
Purchase Details
Closed on
May 12, 2014
Sold by
Berry Leland C and Berry Billie L
Bought by
Weissenfluh Ryan J and Purkeypyle Lindsay C
Home Financials for this Owner
Home Financials are based on the most recent Mortgage that was taken out on this home.
Original Mortgage
$184,103
Interest Rate
4.25%
Mortgage Type
FHA
Create a Home Valuation Report for This Property
The Home Valuation Report is an in-depth analysis detailing your home's value as well as a comparison with similar homes in the area
Home Values in the Area
Average Home Value in this Area
Purchase History
| Date | Buyer | Sale Price | Title Company |
|---|---|---|---|
| Weissenfluh Ryan J | -- | Fidelity Natl Ttl Fishers La | |
| Weissenfluh Ryan J | $187,219 | Stewart Title |
Source: Public Records
Mortgage History
| Date | Status | Borrower | Loan Amount |
|---|---|---|---|
| Open | Weissenfluh Ryan J | $256,000 | |
| Closed | Weissenfluh Ryan J | $184,103 |
Source: Public Records
Tax History Compared to Growth
Tax History
| Year | Tax Paid | Tax Assessment Tax Assessment Total Assessment is a certain percentage of the fair market value that is determined by local assessors to be the total taxable value of land and additions on the property. | Land | Improvement |
|---|---|---|---|---|
| 2025 | $3,815 | $398,079 | $120,000 | $278,079 |
| 2024 | $3,728 | $401,982 | $144,000 | $257,982 |
| 2023 | $3,641 | $411,043 | $154,800 | $256,243 |
| 2022 | $3,602 | $393,185 | $154,800 | $238,385 |
| 2021 | $3,376 | $337,557 | $132,000 | $205,557 |
| 2020 | $3,238 | $296,915 | $120,000 | $176,915 |
| 2019 | $2,860 | $289,222 | $120,000 | $169,222 |
| 2018 | $3,171 | $270,148 | $0 | $0 |
| 2017 | $2,610 | $247,212 | $0 | $0 |
| 2016 | $2,534 | $223,494 | $0 | $0 |
| 2015 | $2,432 | $198,413 | $0 | $0 |
| 2014 | -- | $189,425 | $0 | $0 |
| 2013 | -- | $167,827 | $0 | $0 |
Source: Public Records
Map
Nearby Homes
- 4309 C St
- 1002 40th St
- 4363 Addy Loop
- 1061 40th St
- 4202 L Cir
- 3600 A St Unit 6
- 698 51st St
- 3777 Addy St Unit 56
- 3777 Addy St Unit 12
- 3777 Addy St Unit 16
- 4501 Addy St Unit 91
- 4501 Addy St Unit 121
- 4501 Addy St Unit 30
- 4501 Addy St Unit 101
- 4501 Addy St Unit 67
- 1262 48th St
- 756 Sunset Ridge Dr
- 4209 P St
- 4353 M Dr
- 3301 K St
- 4221 F Cir
- 4301 McCallister Place
- 4314 F Cir
- 4308 McCallister Place
- 4307 F Cir
- 4269 F Cir
- 4316 F Cir
- 4220 Liedtke Way
- 4304 McCallister Place
- 4319 F Cir
- 4220 F Cir
- 4312 F Cir
- 4310 McCallister Place
- 4218 Mc Allister Place
- 4218 McCallister Place
- 603 45th Ct
- 4213 McCallister Place
- 4315 McCallister Place
- 611 45th Ct
- 515 45th Ct