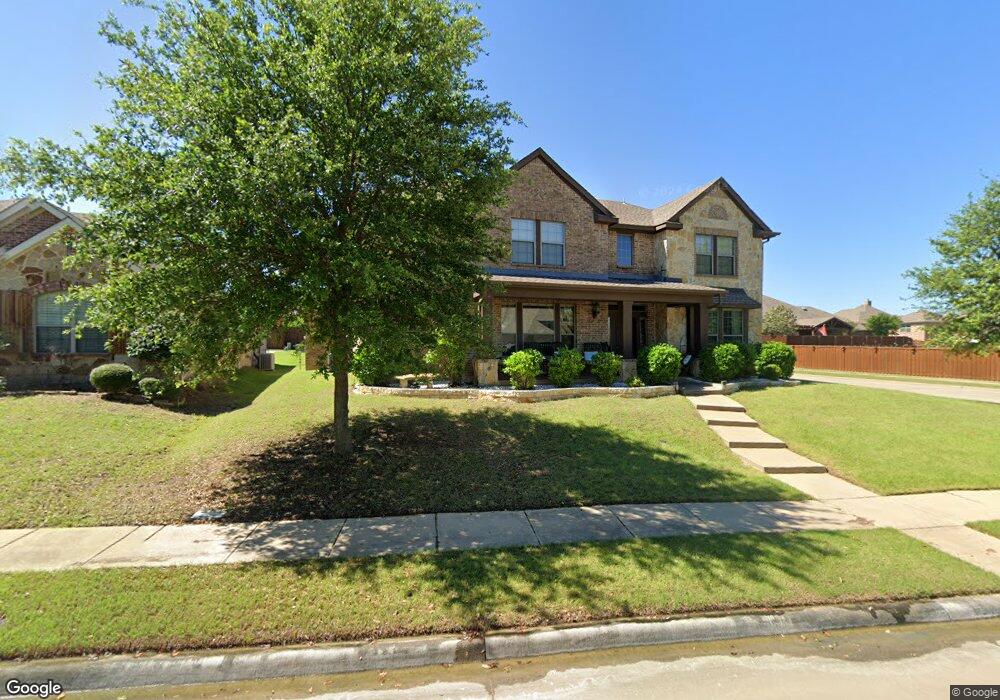
4306 Glenview Dr Sachse, TX 75048
Estimated Value: $614,334 - $653,000
4
Beds
4
Baths
3,713
Sq Ft
$172/Sq Ft
Est. Value
About This Home
This home is located at 4306 Glenview Dr, Sachse, TX 75048 and is currently estimated at $639,084, approximately $172 per square foot. 4306 Glenview Dr is a home located in Collin County with nearby schools including Don Whitt Elementary School, Dr. Al Draper Intermediate Middle School, and Raymond B Cooper J High School.
Ownership History
Date
Name
Owned For
Owner Type
Purchase Details
Closed on
Jun 27, 2011
Sold by
Fannie Mae
Bought by
Howard William J and Howard Merry D
Current Estimated Value
Home Financials for this Owner
Home Financials are based on the most recent Mortgage that was taken out on this home.
Original Mortgage
$209,700
Outstanding Balance
$145,285
Interest Rate
4.66%
Mortgage Type
New Conventional
Estimated Equity
$493,799
Purchase Details
Closed on
Feb 1, 2011
Sold by
Nolan James Bryan and Nolan Jeannie L
Bought by
Federal National Mortgage Association
Purchase Details
Closed on
Sep 28, 2006
Sold by
Weekley Homes Lp
Bought by
Nolan James B and Nolan Jeannie
Home Financials for this Owner
Home Financials are based on the most recent Mortgage that was taken out on this home.
Original Mortgage
$257,450
Interest Rate
6.47%
Mortgage Type
Purchase Money Mortgage
Create a Home Valuation Report for This Property
The Home Valuation Report is an in-depth analysis detailing your home's value as well as a comparison with similar homes in the area
Home Values in the Area
Average Home Value in this Area
Purchase History
| Date | Buyer | Sale Price | Title Company |
|---|---|---|---|
| Howard William J | -- | Stewart Title North Texas In | |
| Federal National Mortgage Association | $275,443 | None Available | |
| Nolan James B | -- | Ptc |
Source: Public Records
Mortgage History
| Date | Status | Borrower | Loan Amount |
|---|---|---|---|
| Open | Howard William J | $209,700 | |
| Previous Owner | Nolan James B | $257,450 |
Source: Public Records
Tax History Compared to Growth
Tax History
| Year | Tax Paid | Tax Assessment Tax Assessment Total Assessment is a certain percentage of the fair market value that is determined by local assessors to be the total taxable value of land and additions on the property. | Land | Improvement |
|---|---|---|---|---|
| 2025 | $9,702 | $581,456 | $148,500 | $458,179 |
| 2024 | $9,702 | $528,596 | $148,500 | $450,011 |
| 2023 | $9,702 | $480,542 | $137,500 | $433,073 |
| 2022 | $9,969 | $436,856 | $137,500 | $382,949 |
| 2021 | $9,571 | $397,142 | $93,500 | $303,642 |
| 2020 | $9,784 | $389,092 | $93,500 | $295,592 |
| 2019 | $9,854 | $375,808 | $93,500 | $282,308 |
| 2018 | $9,958 | $374,467 | $93,500 | $280,967 |
| 2017 | $9,631 | $362,140 | $93,500 | $268,640 |
| 2016 | $9,136 | $349,609 | $82,500 | $267,109 |
| 2015 | $7,386 | $323,837 | $82,500 | $241,337 |
Source: Public Records
Map
Nearby Homes
- 7811 Glen Hollow Ln
- 4125 Caprock Canyon Rd
- 3521 Meadowside Dr
- 7213 Bronco Bluff
- 725 Prosper Ln
- 721 Prosper Ln
- 2902 Wheelhouse Way
- 2904 Wheelhouse Way
- 7114 Running Iron Trail
- 729 Tower Rd
- 730 Tower Rd
- 725 Tower Rd
- 723 Tower Rd
- 3604 Texas Dr
- 2837 Concord Dr
- 2835 Concord Dr
- 2833 Concord Dr
- 708 Prosper Ln
- 2821 Concord Dr
- 2863 Concord Dr
- 4310 Glenview Dr
- 4220 Glenview Dr
- 4316 Glenview Dr
- 4305 Oak Bluff Ln
- 7823 Hillsdale Dr
- 4305 Glenview Dr
- 4311 Oak Bluff Ln
- 4311 Glenview Dr
- 4303 Glenview Dr
- 4216 Glenview Dr
- 4317 Oak Bluff Ln
- 4219 Glenview Dr
- 4315 Glenview Dr
- 7823 Meadow Glen Dr
- 7819 Meadow Glen Dr
- 7815 Hillsdale Dr
- 7815 Meadow Glen Dr
- 4217 Glenview Dr
- 7820 Shadow Glen Trail
- 4208 Glenview Dr