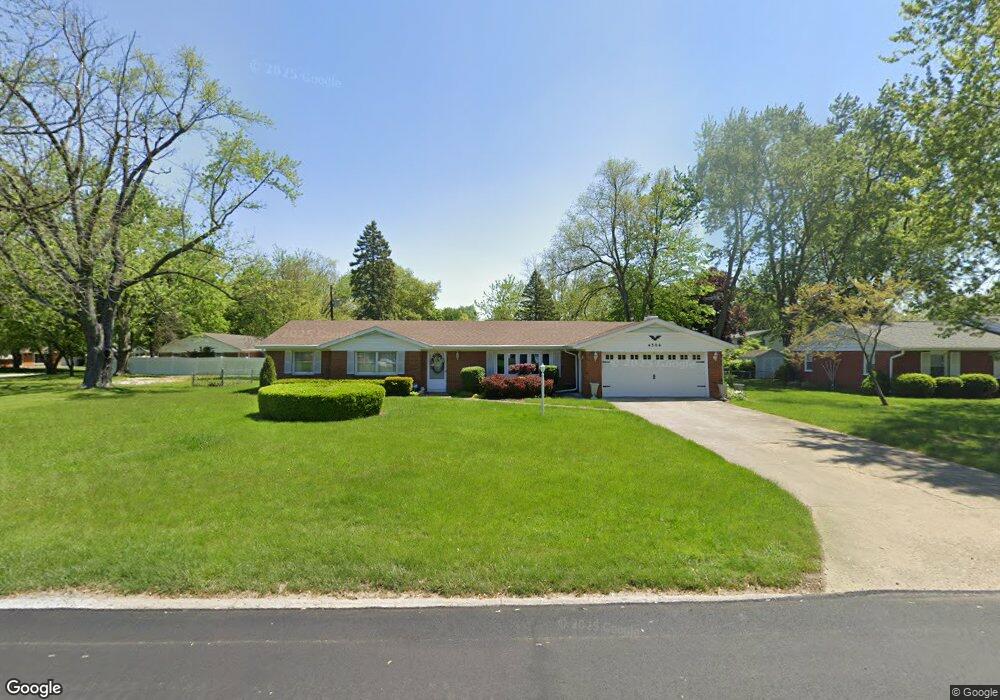
4306 N Tillotson Ave Muncie, IN 47304
Halteman NeighborhoodEstimated Value: $219,000 - $247,000
3
Beds
2
Baths
2,209
Sq Ft
$104/Sq Ft
Est. Value
About This Home
This home is located at 4306 N Tillotson Ave, Muncie, IN 47304 and is currently estimated at $229,205, approximately $103 per square foot. 4306 N Tillotson Ave is a home located in Delaware County with nearby schools including North View Elementary School, Muncie Central High School, and Northside Middle School.
Ownership History
Date
Name
Owned For
Owner Type
Purchase Details
Closed on
Jun 29, 2022
Sold by
Martha Quinton
Bought by
Martha Quinton Trust
Current Estimated Value
Purchase Details
Closed on
Aug 6, 2015
Sold by
Rabenstein Victoria Lynn and Johnson Anthony Dean
Bought by
Quinton Vernon and Quinton Martha
Purchase Details
Closed on
Sep 13, 2013
Sold by
Rvz Inc
Bought by
Johnson Evelyn M
Home Financials for this Owner
Home Financials are based on the most recent Mortgage that was taken out on this home.
Original Mortgage
$87,200
Interest Rate
4.39%
Mortgage Type
New Conventional
Purchase Details
Closed on
Apr 10, 2013
Sold by
Delaware County Sheriff
Bought by
Rvz Inc
Purchase Details
Closed on
May 25, 2005
Sold by
Dovis Robert E and Dovis Geraldine
Bought by
Gegenheimer Merle W and Gegenheimer Patricia I
Home Financials for this Owner
Home Financials are based on the most recent Mortgage that was taken out on this home.
Original Mortgage
$112,500
Interest Rate
7.75%
Mortgage Type
Adjustable Rate Mortgage/ARM
Create a Home Valuation Report for This Property
The Home Valuation Report is an in-depth analysis detailing your home's value as well as a comparison with similar homes in the area
Home Values in the Area
Average Home Value in this Area
Purchase History
| Date | Buyer | Sale Price | Title Company |
|---|---|---|---|
| Martha Quinton Trust | -- | Uaw-Fca-Ford-General Motors Le | |
| Quinton Vernon | -- | -- | |
| Johnson Evelyn M | -- | Youngs Title | |
| Rvz Inc | -- | -- | |
| Gegenheimer Merle W | -- | None Available |
Source: Public Records
Mortgage History
| Date | Status | Borrower | Loan Amount |
|---|---|---|---|
| Previous Owner | Johnson Evelyn M | $87,200 | |
| Previous Owner | Gegenheimer Merle W | $112,500 |
Source: Public Records
Tax History Compared to Growth
Tax History
| Year | Tax Paid | Tax Assessment Tax Assessment Total Assessment is a certain percentage of the fair market value that is determined by local assessors to be the total taxable value of land and additions on the property. | Land | Improvement |
|---|---|---|---|---|
| 2024 | $1,894 | $177,600 | $27,800 | $149,800 |
| 2023 | $1,947 | $182,700 | $27,800 | $154,900 |
| 2022 | $1,823 | $170,300 | $27,800 | $142,500 |
| 2021 | $1,580 | $146,000 | $25,600 | $120,400 |
| 2020 | $1,417 | $129,700 | $22,200 | $107,500 |
| 2019 | $1,347 | $122,700 | $22,200 | $100,500 |
| 2018 | $1,331 | $121,300 | $20,000 | $101,300 |
| 2017 | $1,214 | $109,600 | $18,200 | $91,400 |
| 2016 | $1,170 | $105,200 | $18,200 | $87,000 |
| 2014 | $1,057 | $100,000 | $17,400 | $82,600 |
| 2013 | -- | $103,400 | $17,400 | $86,000 |
Source: Public Records
Map
Nearby Homes
- 4401 N Redding Rd
- 2609 W Lincolnshire Dr
- 4501 N Wheeling Ave Unit 6B-102
- 4501 N Wheeling Ave Unit 7A-306
- 4501 N Wheeling Ave Unit 5E4
- 4501 N Wheeling Ave
- 4501 N Wheeling Ave Unit 3-106
- 2905 W Woodbridge Dr
- 2508 W Twickingham Dr
- 4501 N Wheeling Ave Unit 3-106
- 3209 W Twickingham Dr
- 2500 W Norwood Dr
- 4501 N Wheeling 2-306 Ave Unit 2-306
- 2011 W Sheffield Dr
- 2210 W Christy Ln
- 3404 W Twickingham Dr
- 4808 N Camelot Dr
- 4210 N Oakwood Ave
- 4304 N Oakwood Ave
- 4917 N Wheeling Ave
- 2807 W Wellington Dr
- 4300 N Tillotson Ave
- 4305 N Manchester Rd
- 4301 N Manchester Rd
- 2801 W Wellington Dr
- 4305 N Tillotson Ave
- 4212 N Tillotson Ave
- 4309 N Tillotson Ave
- 4301 N Tillotson Ave
- 4313 N Tillotson Ave
- 2808 W Wellington Dr
- 2804 W Wellington Dr
- 4300 N Manchester Rd
- 4213 N Tillotson Ave
- 4401 N Tillotson Ave
- 2709 W Wellington Dr
- 4206 N Tillotson Ave
- 4209 N Manchester Rd
- 2800 W Wellington Dr
- 4405 N Tillotson Ave